 15
15peptides
spectra
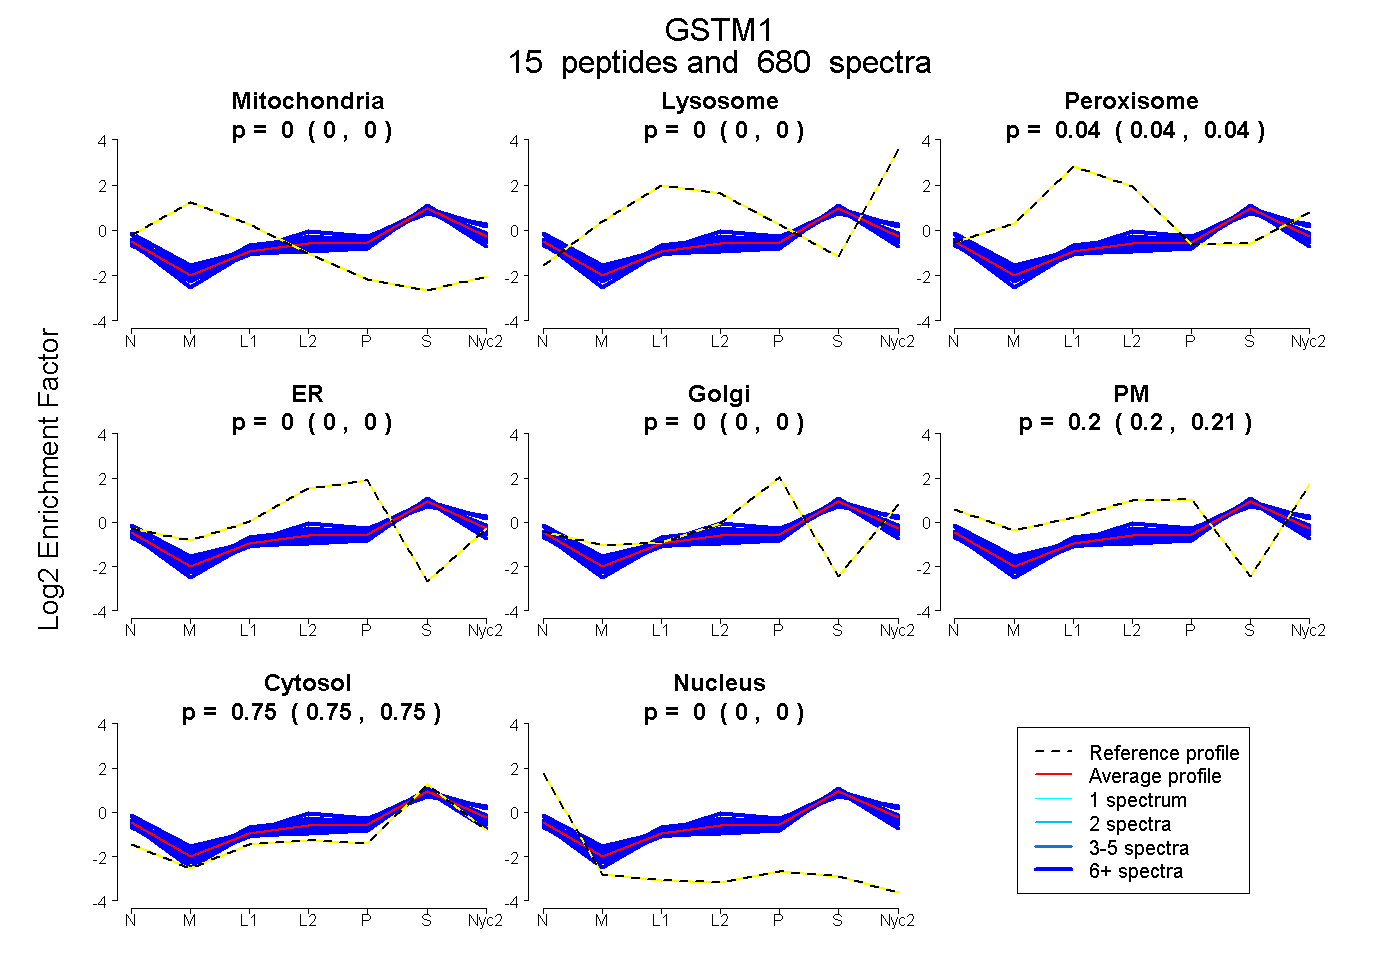
0.000 | 0.000
0.000 | 0.000
0.040 | 0.042
0.000 | 0.000
0.000 | 0.000
0.204 | 0.206
0.753 | 0.754
0.000 | 0.000
16peptides
spectra
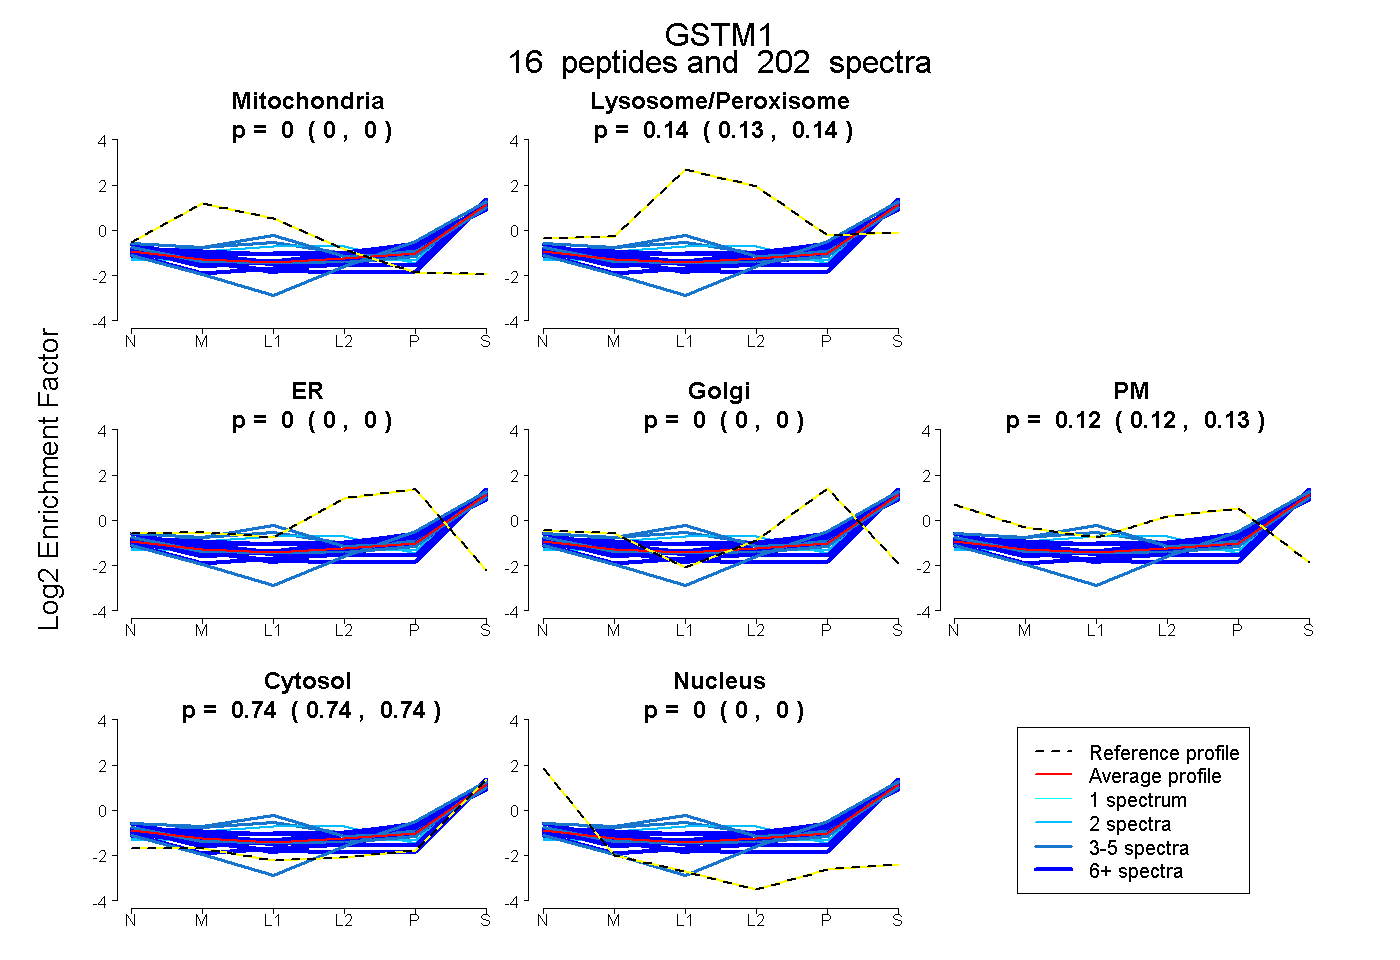
0.000 | 0.000
0.134 | 0.140
0.000 | 0.000
0.000 | 0.000
0.122 | 0.127
0.736 | 0.740
0.000 | 0.000
17peptides
spectra
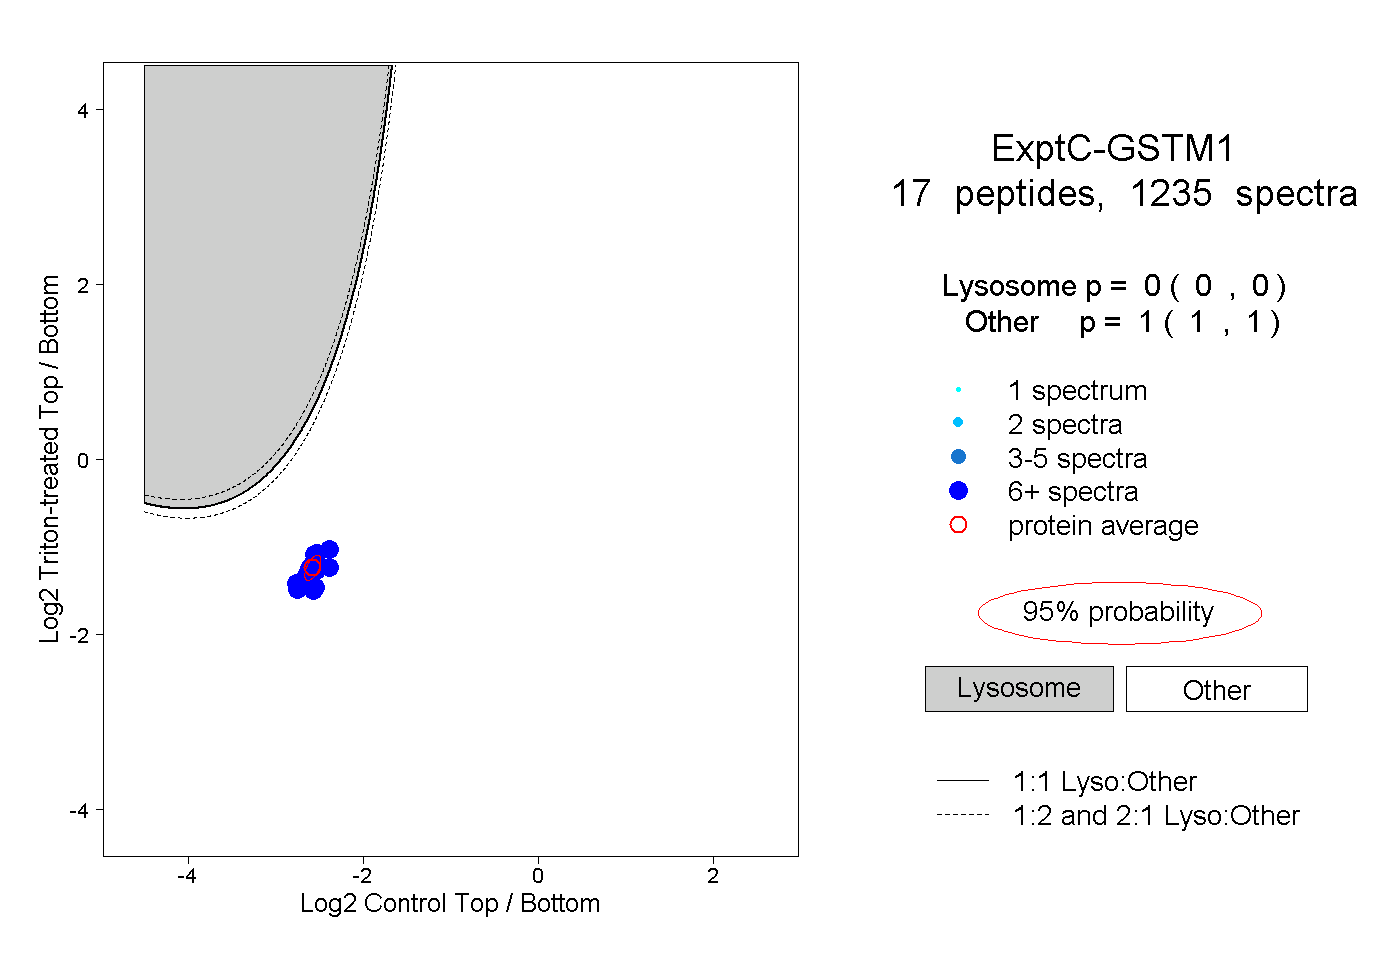
0.000 | 0.000
1.000 | 1.000
14peptides
spectra
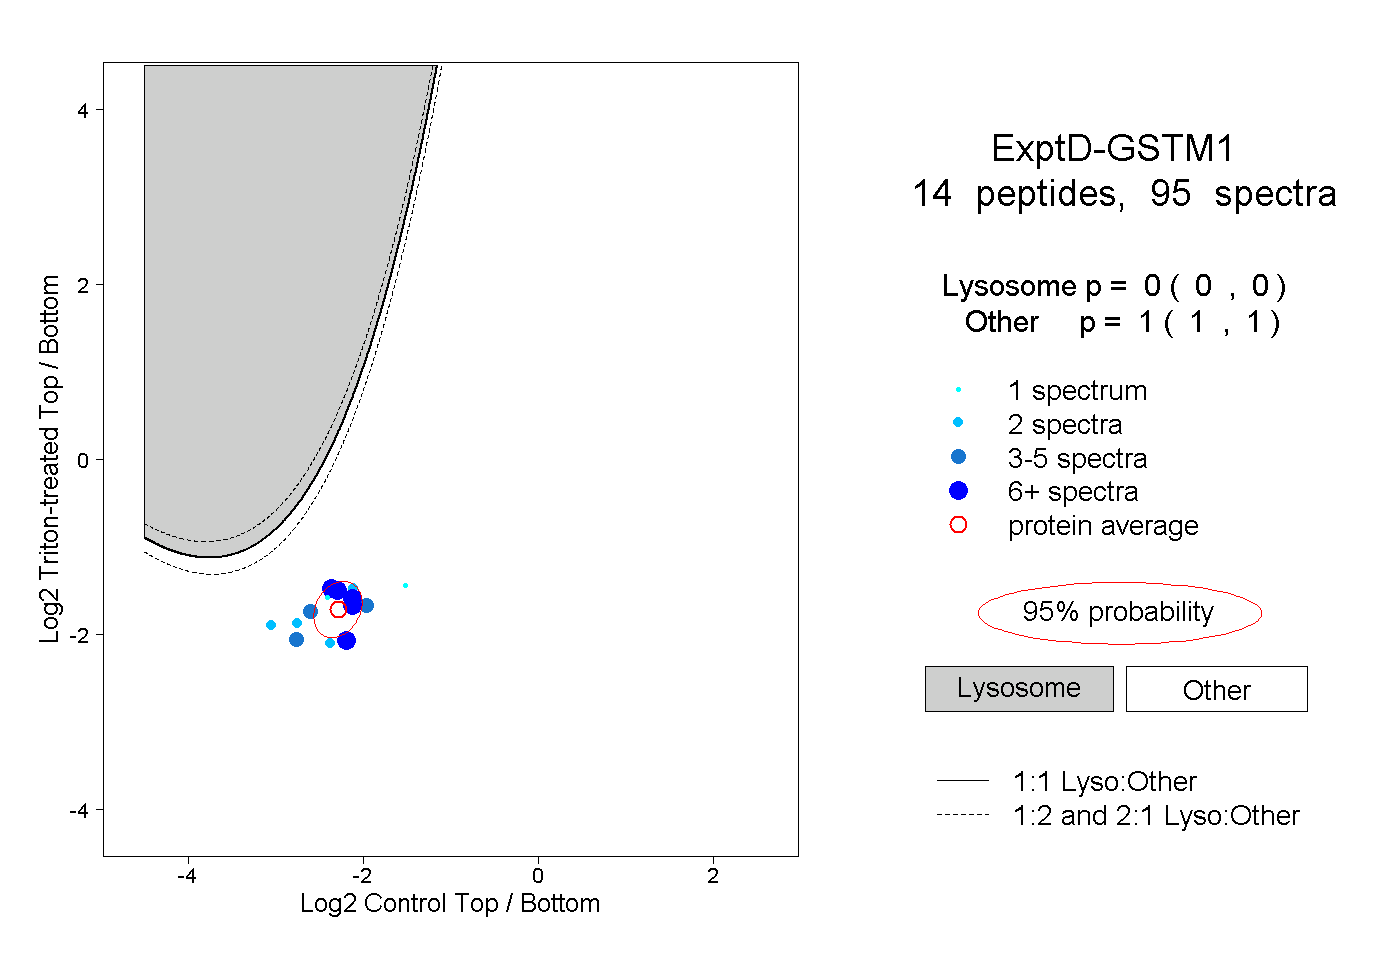
0.000 | 0.000
1.000 | 1.000