 15
15peptides
spectra
0.000 | 0.000
0.000 | 0.000
0.040 | 0.042
0.000 | 0.000
0.000 | 0.000
0.204 | 0.206
0.753 | 0.754
0.000 | 0.000
| Plot | Mito | Lyso | Perox | ER | Golgi | PM | Cytosol | Nucleus | |||||
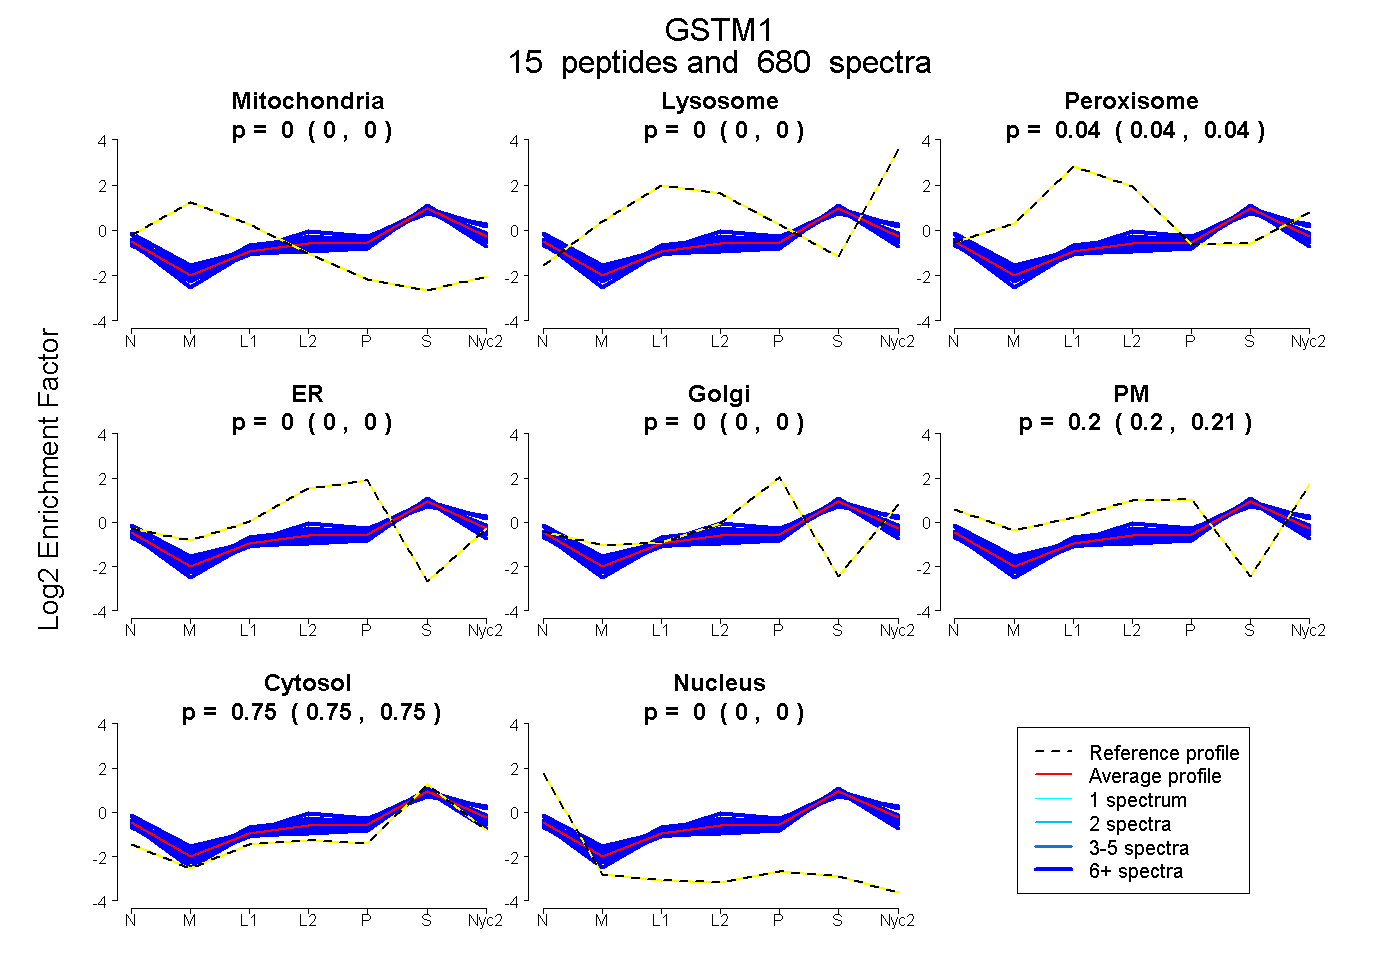
| Expt A |
15 peptides |
680 spectra |
|
0.000 0.000 | 0.000 |
0.000 0.000 | 0.000 |
0.041 0.040 | 0.042 |
0.000 0.000 | 0.000 |
0.000 0.000 | 0.000 |
0.205 0.204 | 0.206 |
0.754 0.753 | 0.754 |
0.000 0.000 | 0.000 |
| 14 spectra, MQLIMLCYNPDFEK | 0.000 | 0.000 | 0.119 | 0.089 | 0.000 | 0.039 | 0.738 | 0.015 | ||
| 75 spectra, ITQSNAIMR | 0.000 | 0.040 | 0.051 | 0.000 | 0.000 | 0.231 | 0.678 | 0.000 | ||
| 41 spectra, ISAYMK | 0.000 | 0.000 | 0.023 | 0.000 | 0.000 | 0.192 | 0.785 | 0.000 | ||
| 40 spectra, LAQWSNK | 0.000 | 0.000 | 0.044 | 0.092 | 0.000 | 0.145 | 0.719 | 0.000 | ||
| 112 spectra, GLTHPIR | 0.000 | 0.000 | 0.013 | 0.038 | 0.000 | 0.142 | 0.807 | 0.000 | ||
| 136 spectra, ADIVENQVMDNR | 0.000 | 0.000 | 0.050 | 0.000 | 0.000 | 0.185 | 0.765 | 0.000 | ||
| 32 spectra, SQWLNEK | 0.000 | 0.000 | 0.056 | 0.000 | 0.000 | 0.211 | 0.733 | 0.000 | ||
| 65 spectra, RPWFAGDK | 0.000 | 0.000 | 0.022 | 0.000 | 0.000 | 0.134 | 0.845 | 0.000 | ||
| 8 spectra, PMILGYWNVR | 0.000 | 0.000 | 0.034 | 0.000 | 0.000 | 0.200 | 0.766 | 0.000 | ||
| 10 spectra, HHLCGETEEER | 0.000 | 0.000 | 0.107 | 0.000 | 0.000 | 0.168 | 0.716 | 0.009 | ||
| 24 spectra, AMILGYWNVR | 0.000 | 0.000 | 0.054 | 0.000 | 0.000 | 0.328 | 0.617 | 0.000 | ||
| 84 spectra, YAMGDAPDYDR | 0.000 | 0.000 | 0.024 | 0.000 | 0.000 | 0.197 | 0.779 | 0.000 | ||
| 10 spectra, QKPEFLK | 0.000 | 0.000 | 0.038 | 0.043 | 0.000 | 0.178 | 0.741 | 0.000 | ||
| 13 spectra, LLLEYTDSSYEEK | 0.000 | 0.046 | 0.000 | 0.000 | 0.000 | 0.207 | 0.747 | 0.000 | ||
| 16 spectra, LGLDFPNLPYLIDGSR | 0.000 | 0.000 | 0.000 | 0.000 | 0.000 | 0.195 | 0.805 | 0.000 |
| Plot | Mito | Lyso or Perox | ER | Golgi | PM | Cytosol | Nucleus | ||||||
| Expt B |
16 peptides |
202 spectra |
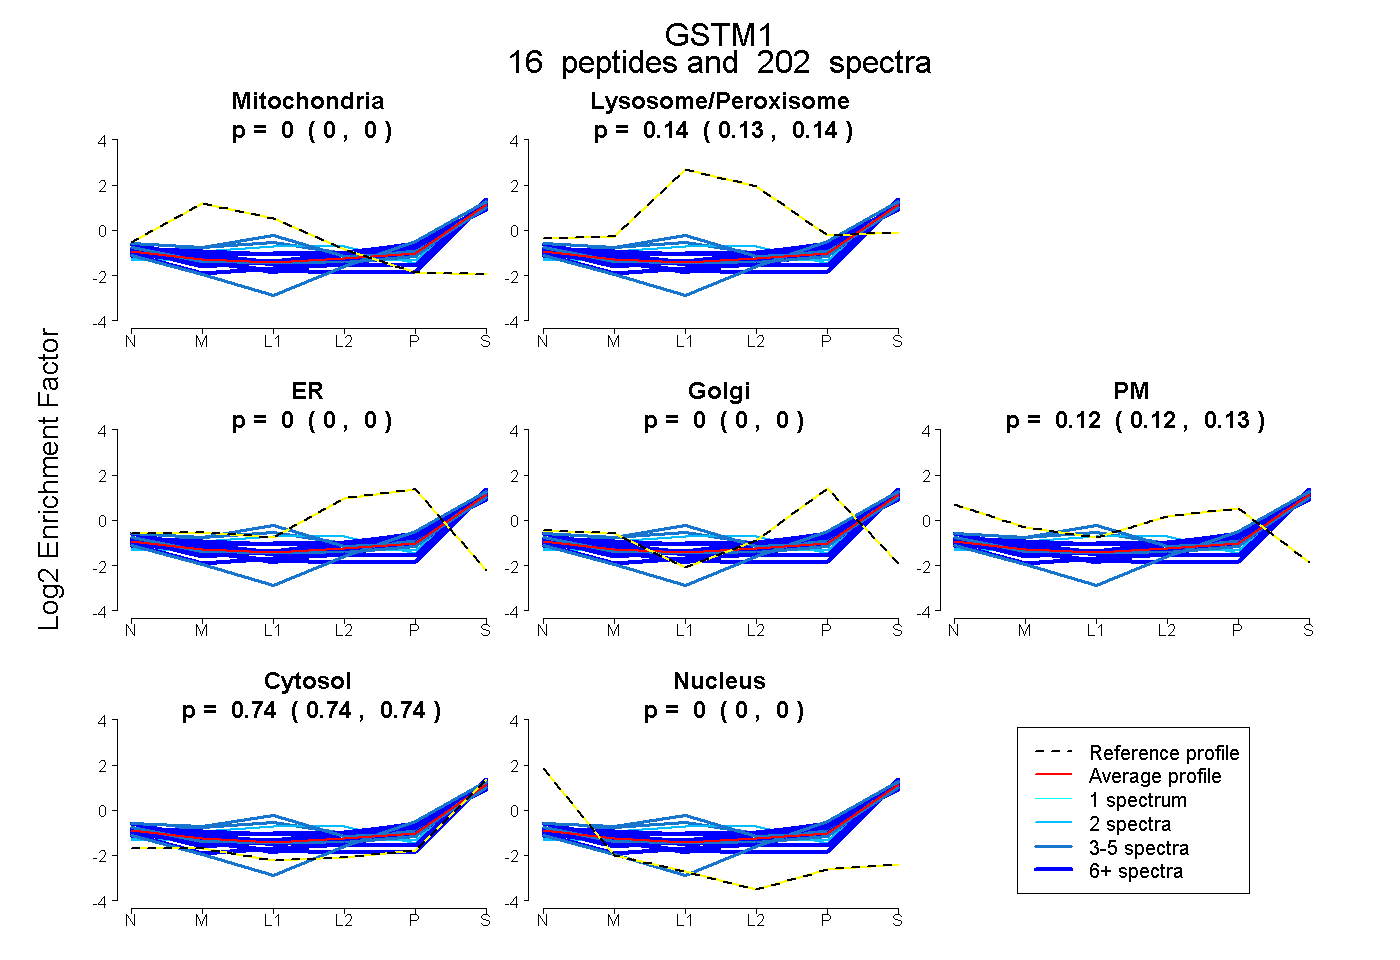 |
0.000 0.000 | 0.000 |
0.137 0.134 | 0.140 |
0.000 0.000 | 0.000 |
0.000 0.000 | 0.000 |
0.125 0.122 | 0.127 |
0.738 0.736 | 0.740 |
0.000 0.000 | 0.000 |
|||
| Plot | Lyso | Other | |||||||||||
| Expt C |
17 peptides |
1235 spectra |
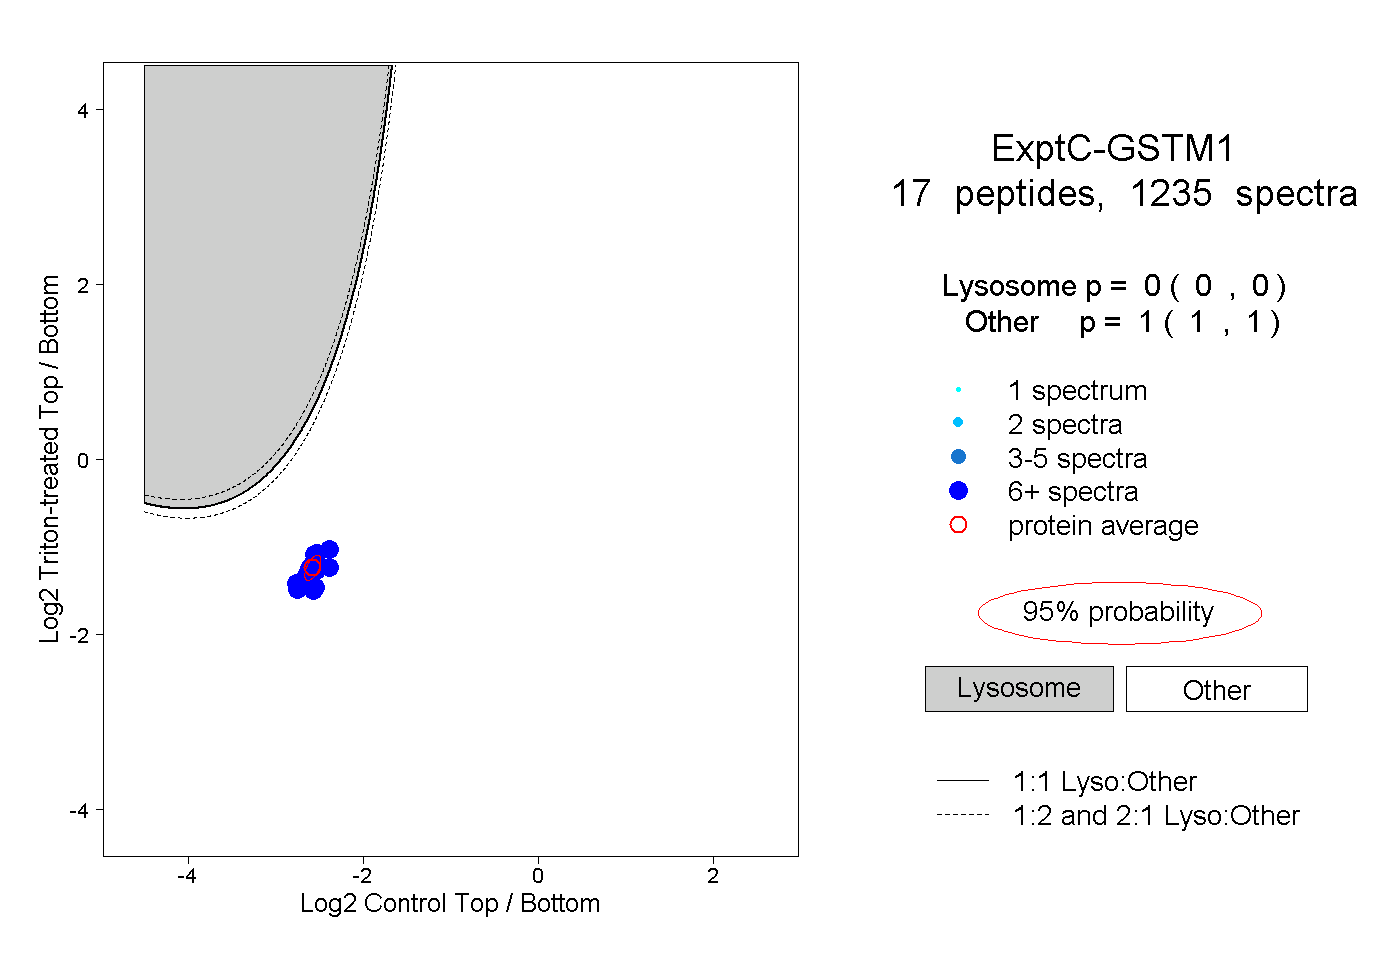 |
0.000 0.000 | 0.000 |
1.000 1.000 | 1.000 |
||||||||
| Plot | Lyso | Other | |||||||||||
| Expt D |
14 peptides |
95 spectra |
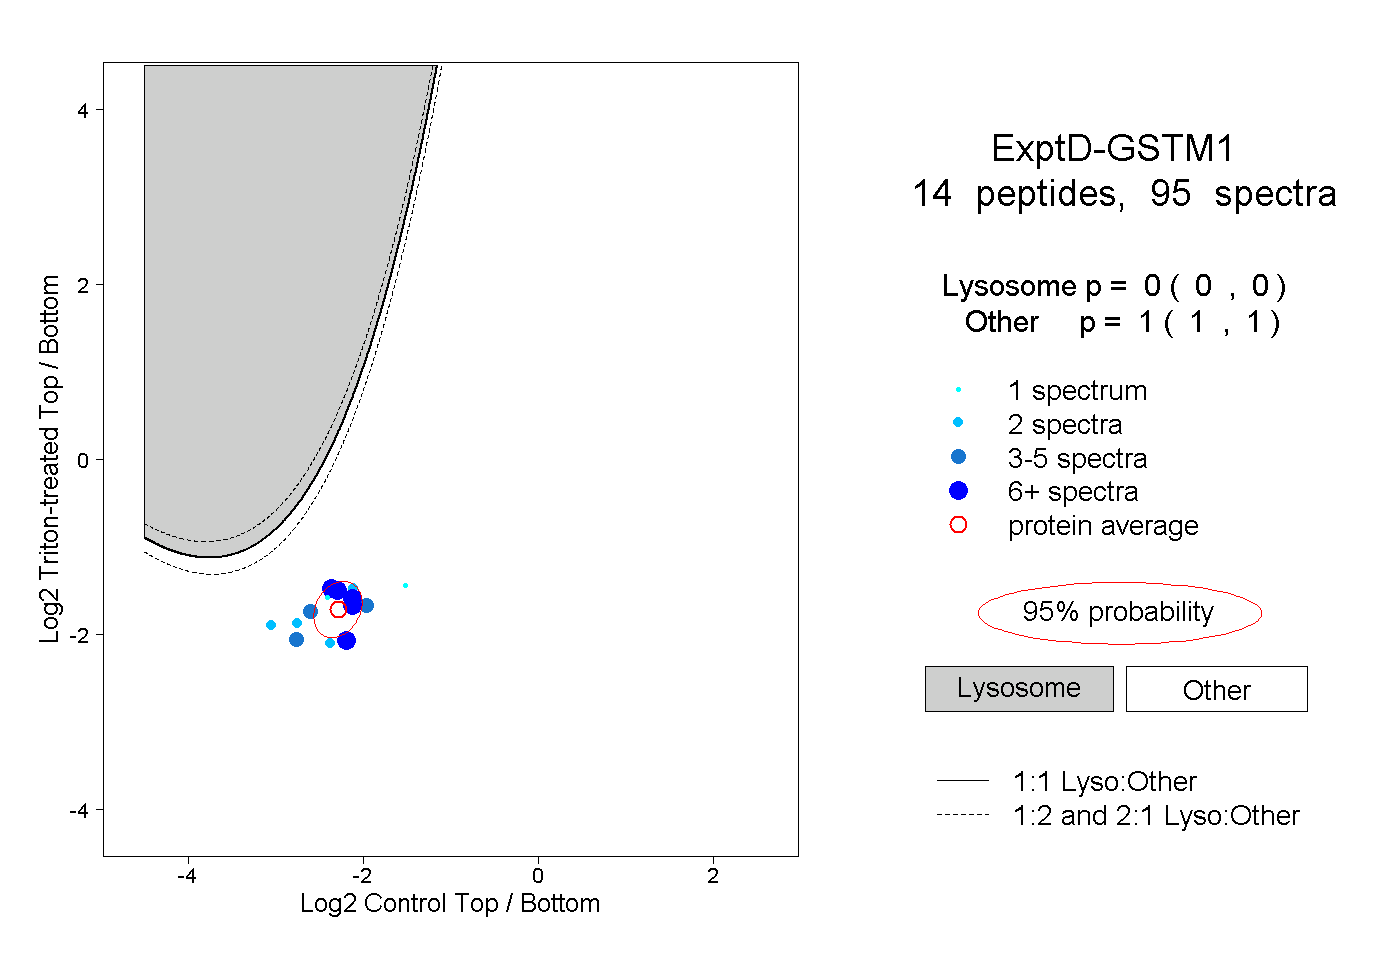 |
0.000 0.000 | 0.000 |
1.000 1.000 | 1.000 |