 3
3peptides
spectra
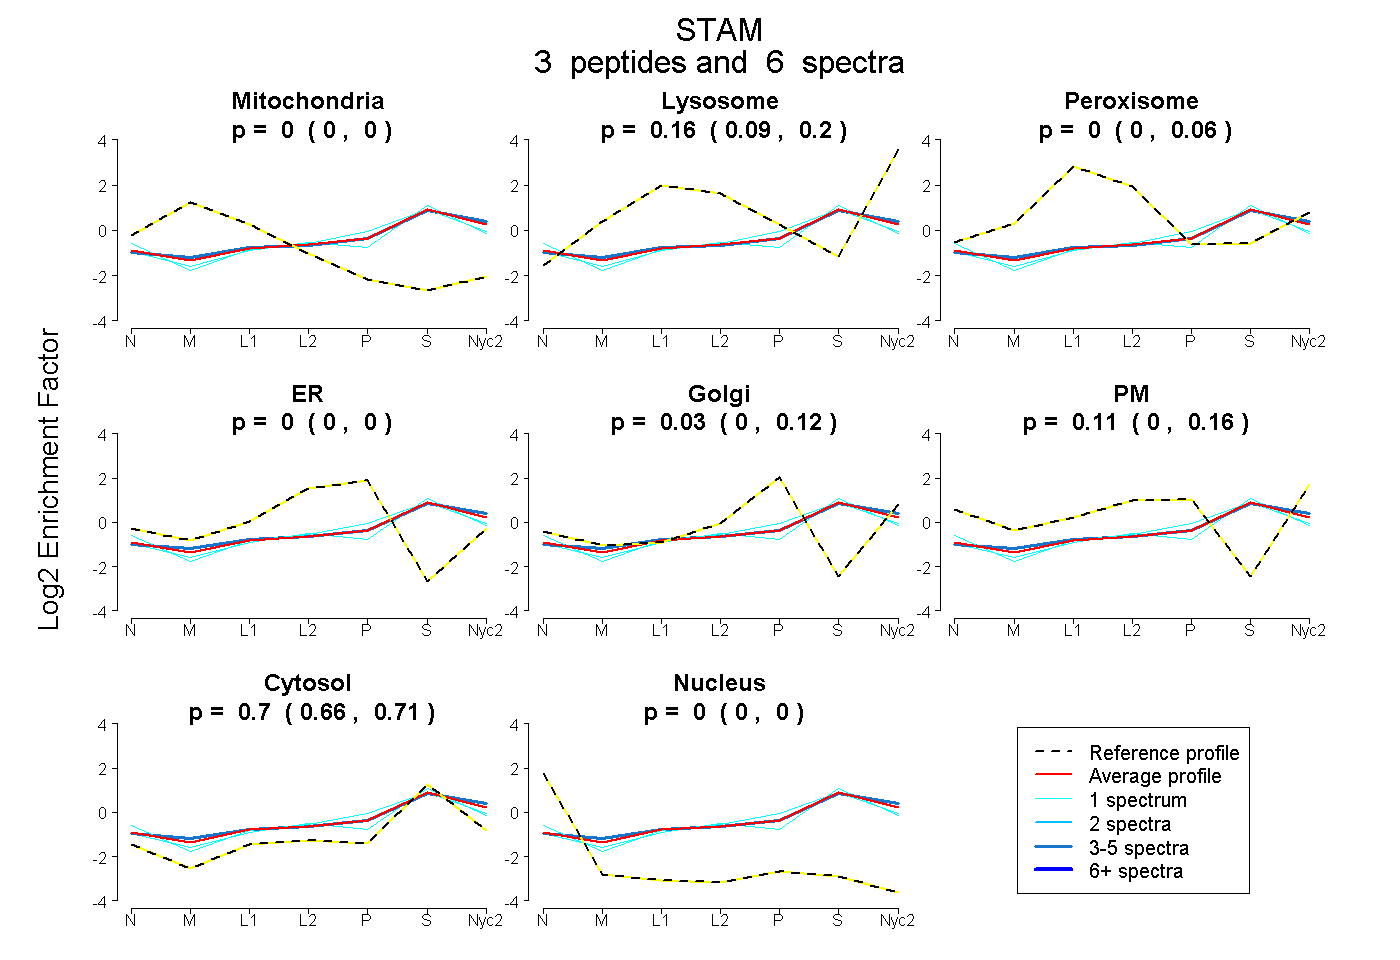
0.000 | 0.000
0.092 | 0.196
0.000 | 0.061
0.000 | 0.000
0.000 | 0.119
0.000 | 0.161
0.662 | 0.714
0.000 | 0.000
1peptide
spectrum
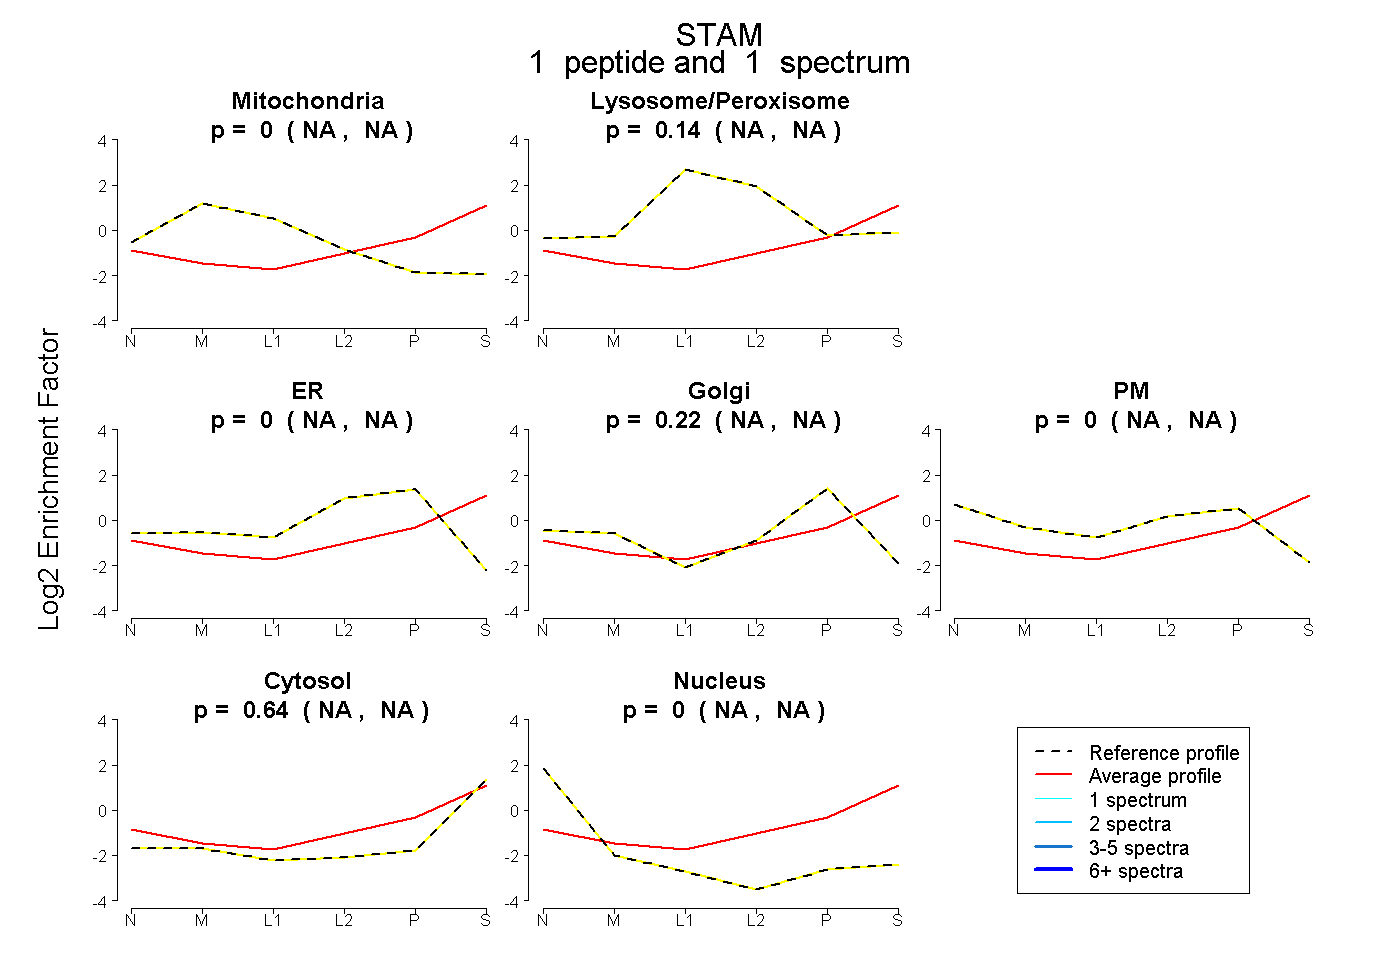
NA | NA
NA | NA
NA | NA
NA | NA
NA | NA
NA | NA
NA | NA
3peptides
spectra
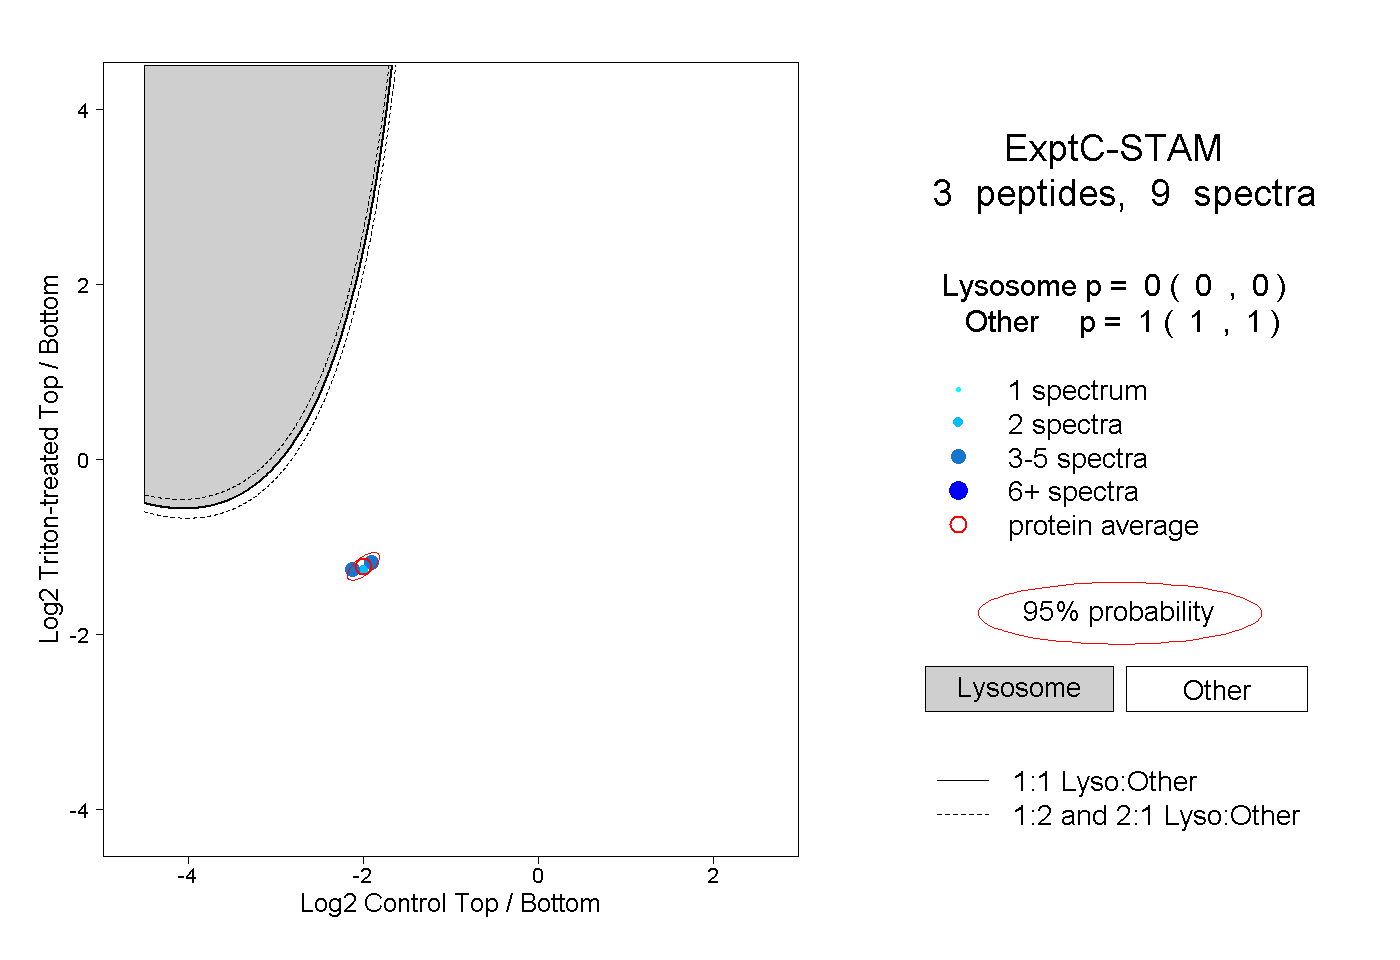
0.000 | 0.000
1.000 | 1.000