 3
3peptides
spectra
0.000 | 0.000
0.092 | 0.196
0.000 | 0.061
0.000 | 0.000
0.000 | 0.119
0.000 | 0.161
0.662 | 0.714
0.000 | 0.000
| Plot | Mito | Lyso | Perox | ER | Golgi | PM | Cytosol | Nucleus | |||||
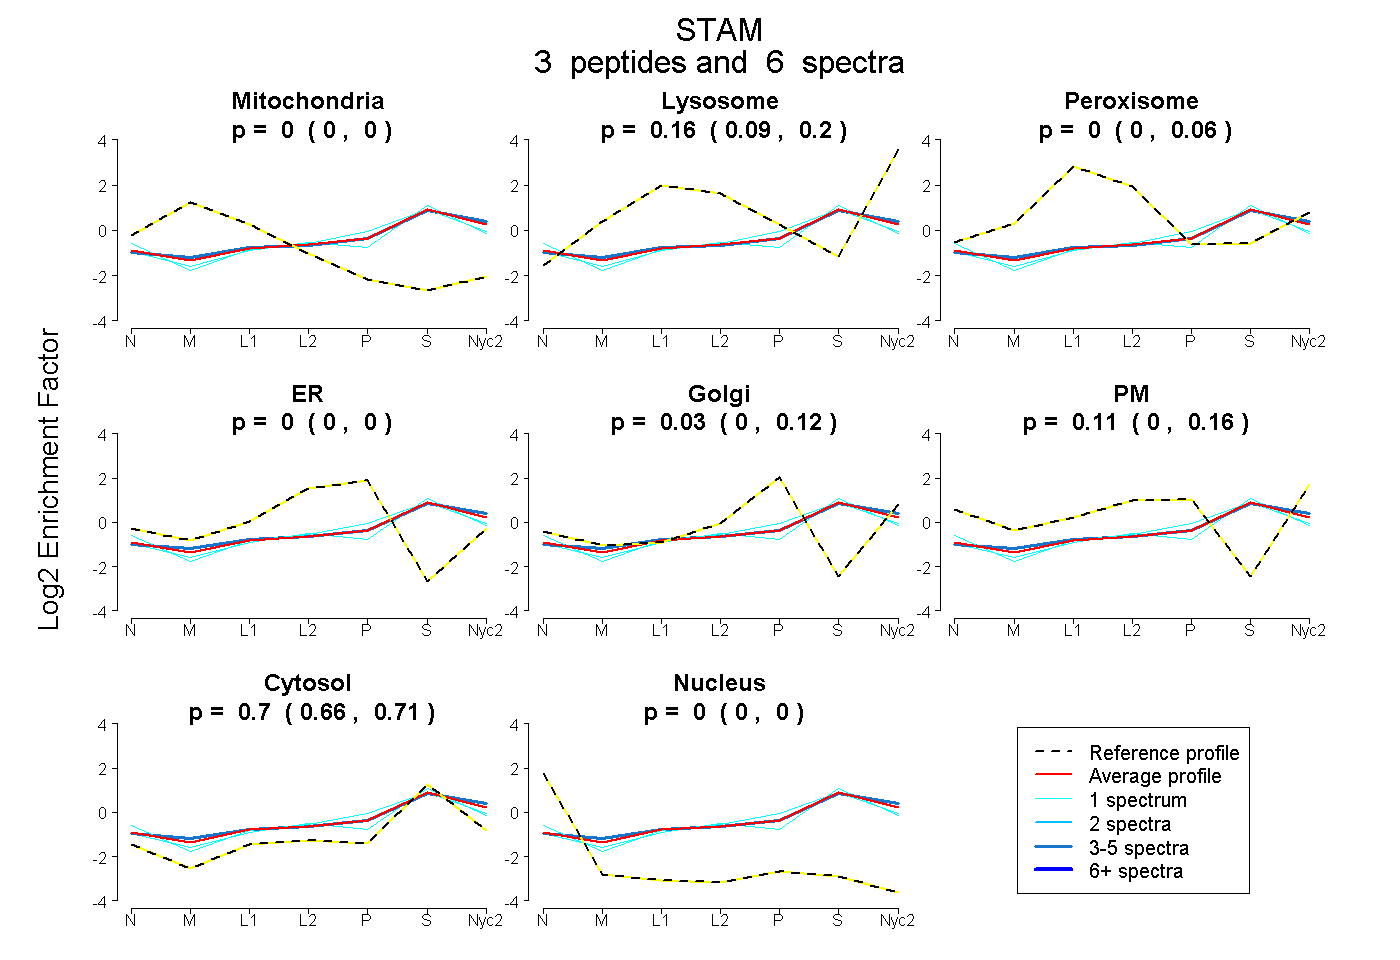
| Expt A |
3 peptides |
6 spectra |
|
0.000 0.000 | 0.000 |
0.158 0.092 | 0.196 |
0.003 0.000 | 0.061 |
0.000 0.000 | 0.000 |
0.033 0.000 | 0.119 |
0.109 0.000 | 0.161 |
0.696 0.662 | 0.714 |
0.000 0.000 | 0.000 |
| 1 spectrum, AIELSLK | 0.000 | 0.059 | 0.090 | 0.000 | 0.000 | 0.090 | 0.761 | 0.000 | ||
| 1 spectrum, VMEALSLYTK | 0.000 | 0.003 | 0.071 | 0.000 | 0.111 | 0.142 | 0.674 | 0.000 | ||
| 4 spectra, DPGTVATK | 0.000 | 0.207 | 0.000 | 0.000 | 0.062 | 0.059 | 0.672 | 0.000 |
| Plot | Mito | Lyso or Perox | ER | Golgi | PM | Cytosol | Nucleus | ||||||
| Expt B |
1 peptide |
1 spectrum |
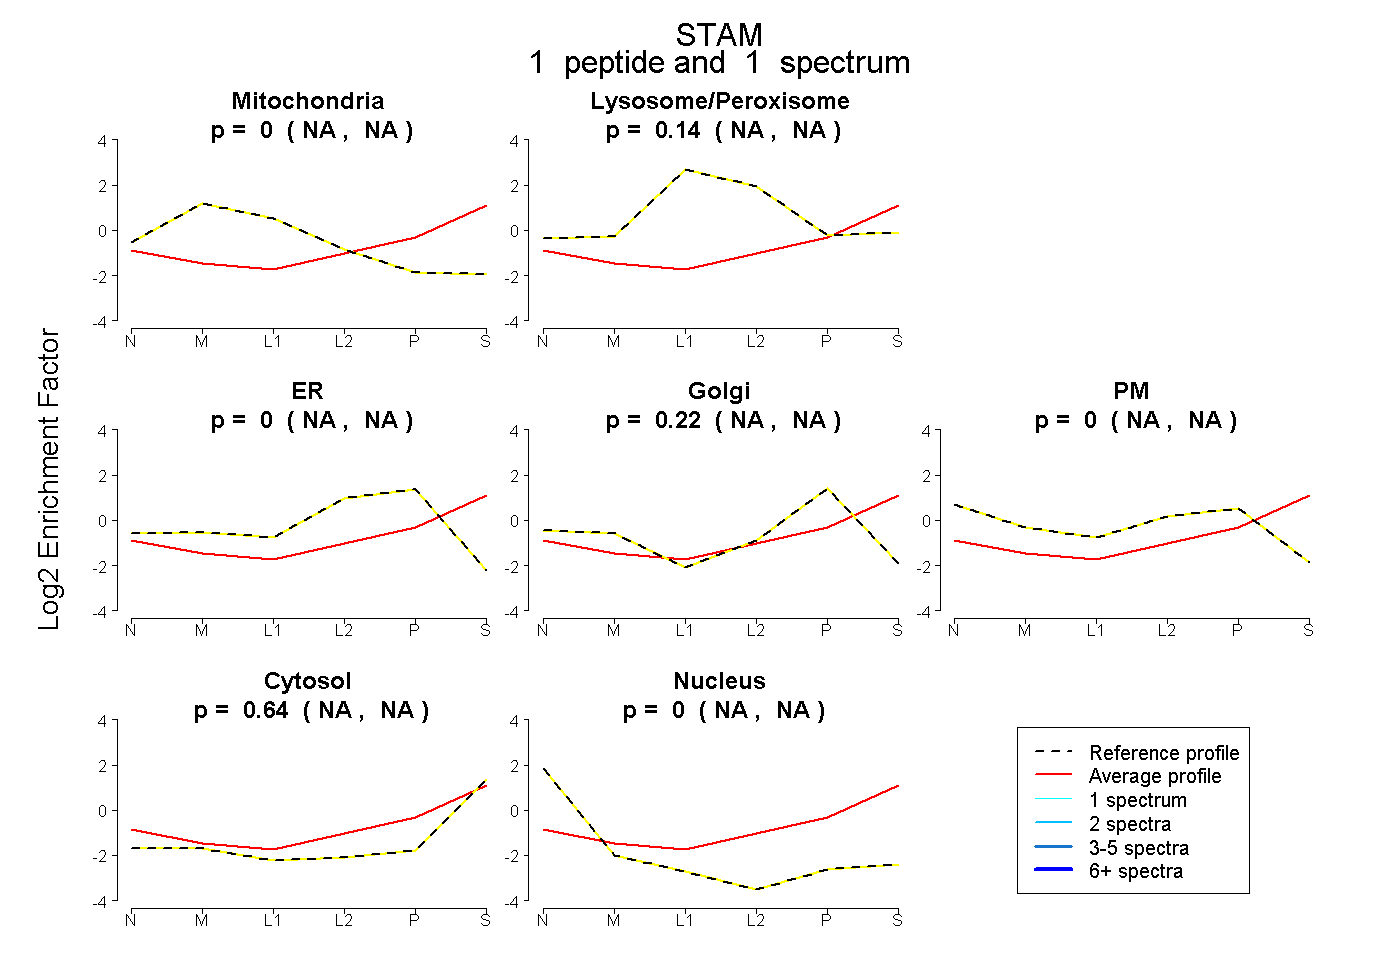 |
0.000 NA | NA |
0.136 NA | NA |
0.000 NA | NA |
0.220 NA | NA |
0.000 NA | NA |
0.644 NA | NA |
0.000 NA | NA |
|||
| Plot | Lyso | Other | |||||||||||
| Expt C |
3 peptides |
9 spectra |
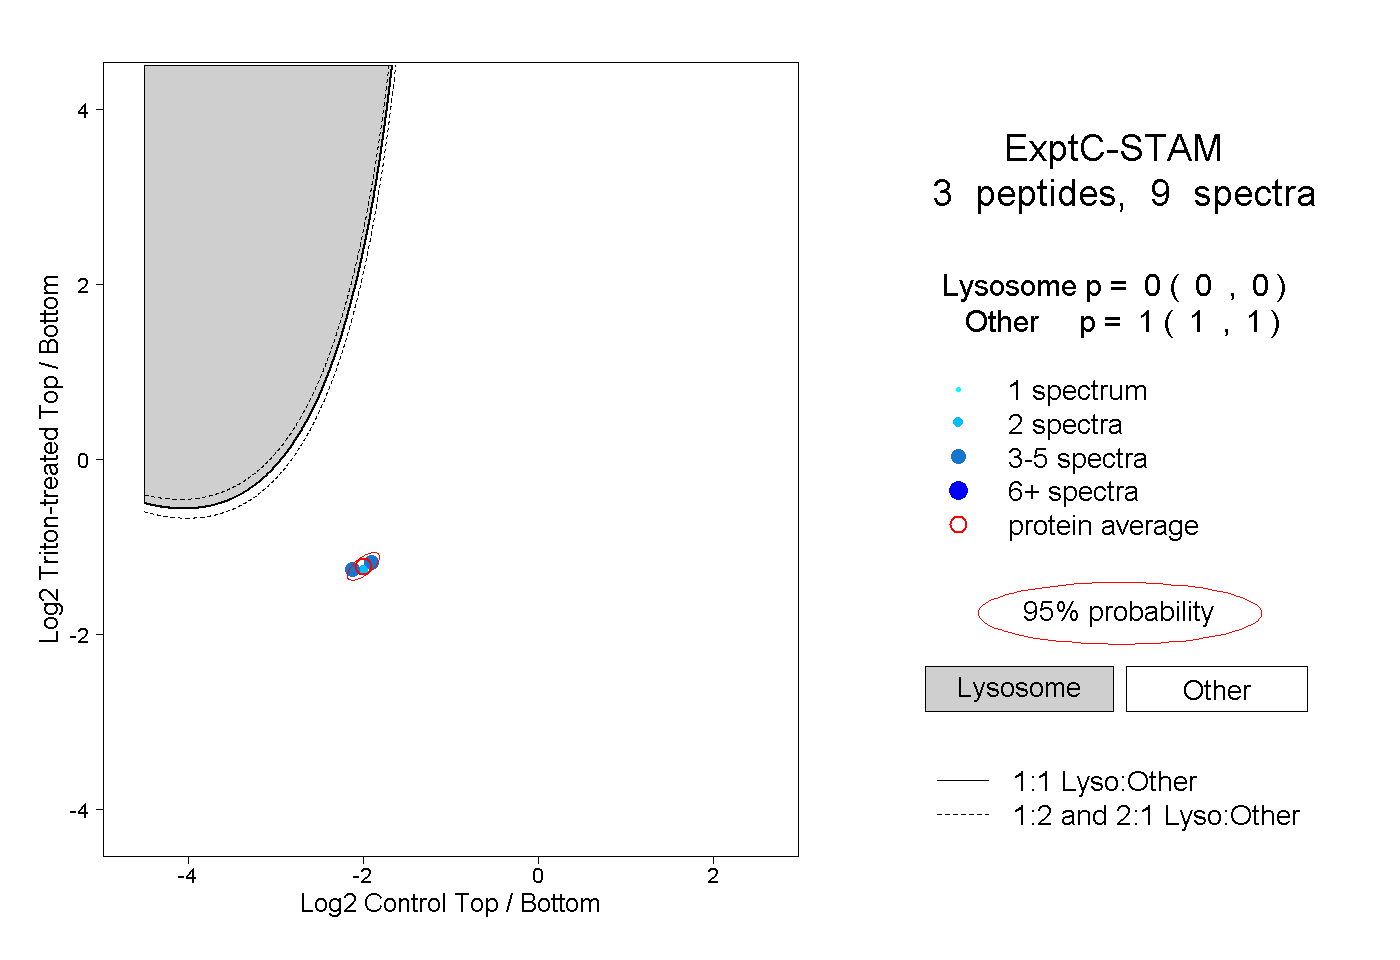 |
0.000 0.000 | 0.000 |
1.000 1.000 | 1.000 |