 5
5peptides
spectra
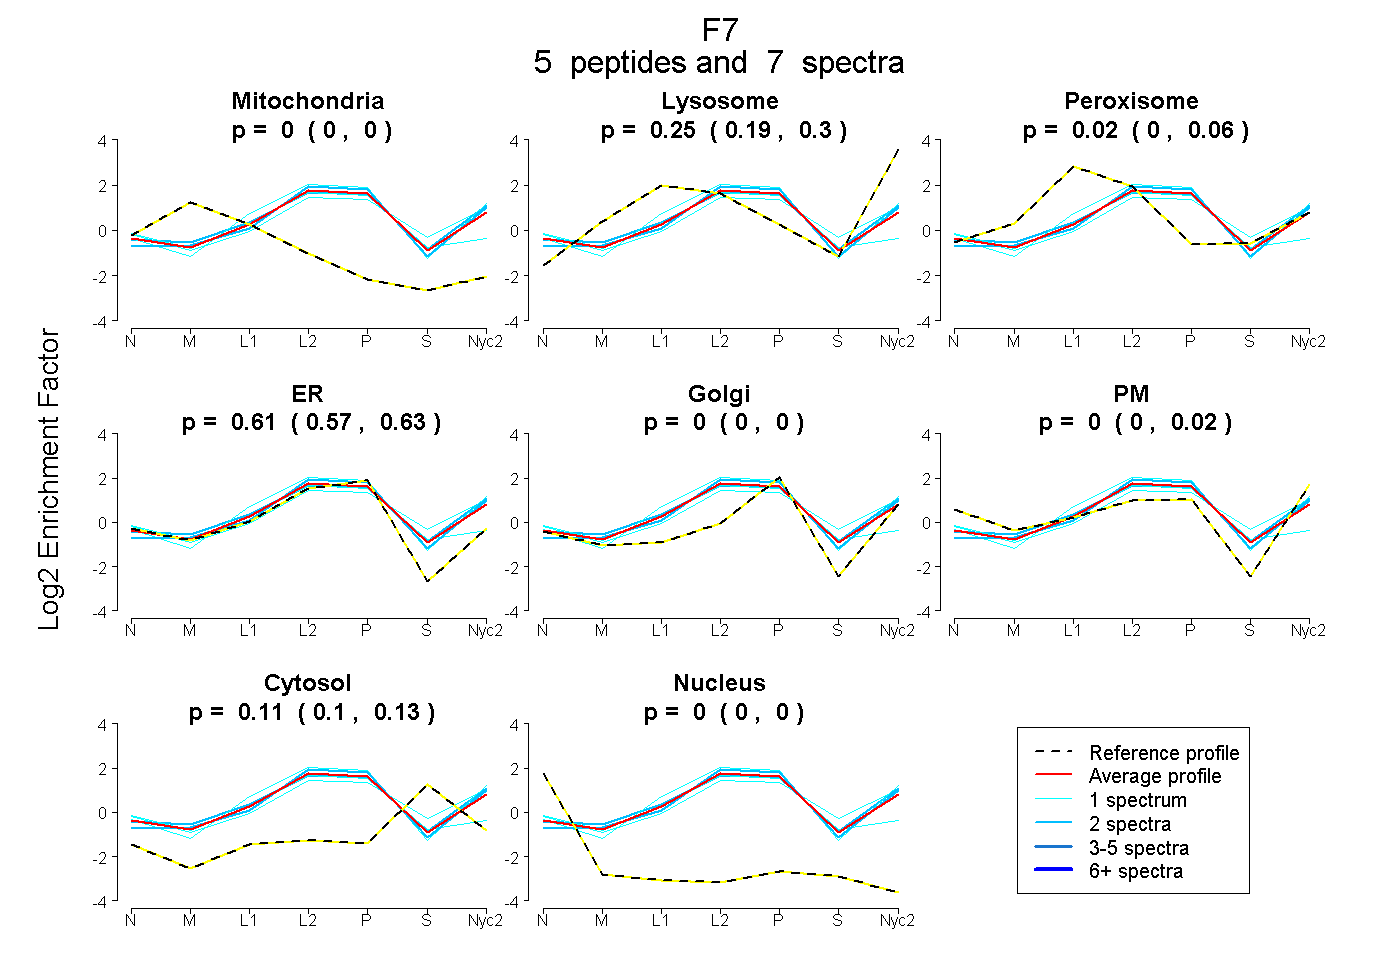
0.000 | 0.000
0.192 | 0.295
0.000 | 0.065
0.573 | 0.631
0.000 | 0.000
0.000 | 0.019
0.098 | 0.126
0.000 | 0.000
1peptide
spectrum
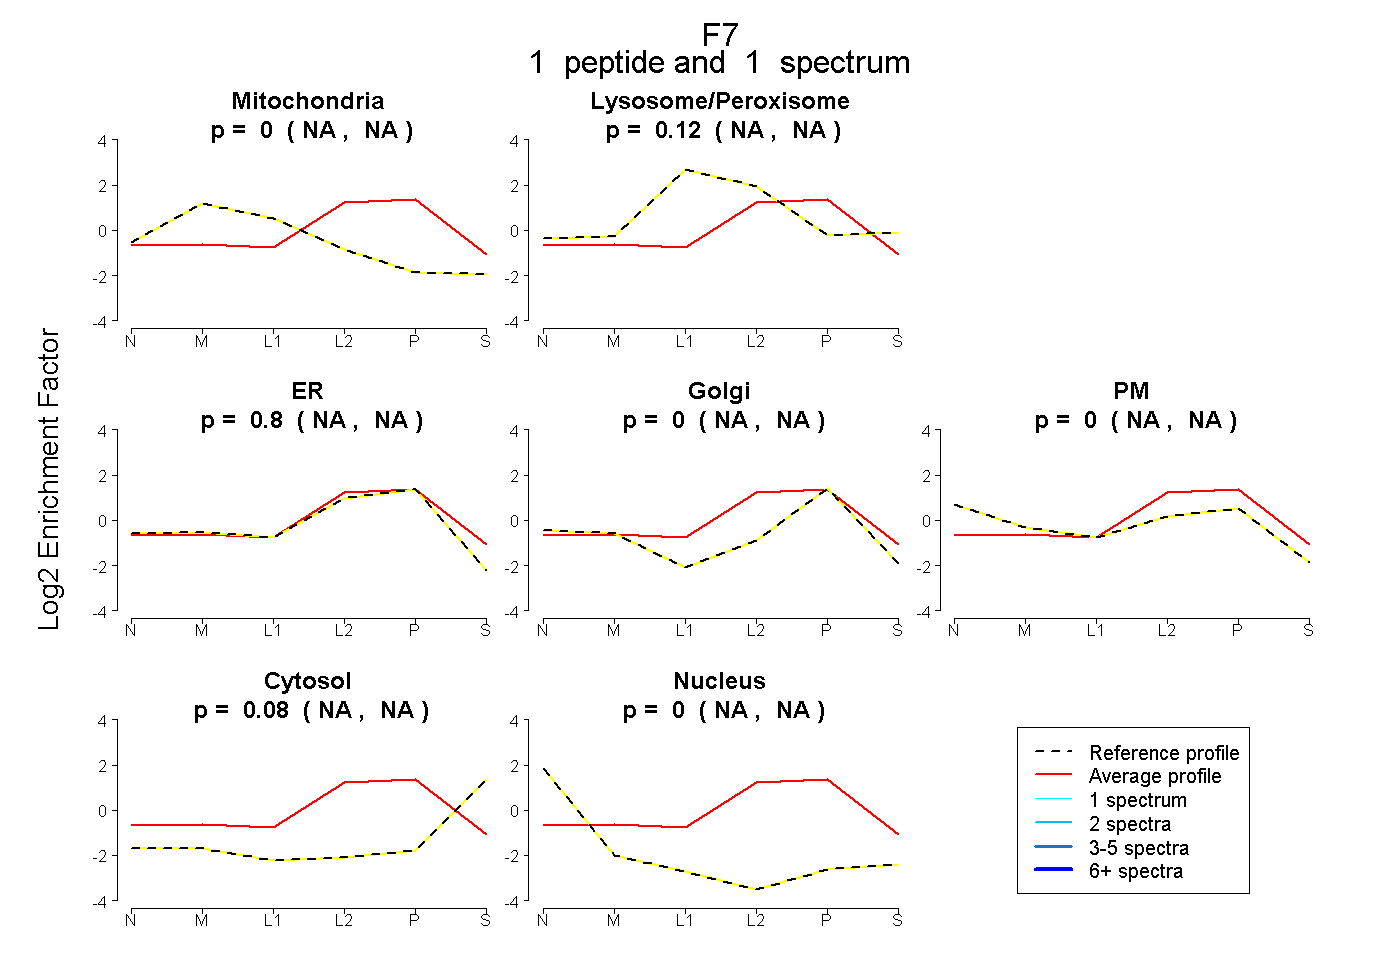
NA | NA
NA | NA
NA | NA
NA | NA
NA | NA
NA | NA
NA | NA
5peptides
spectra
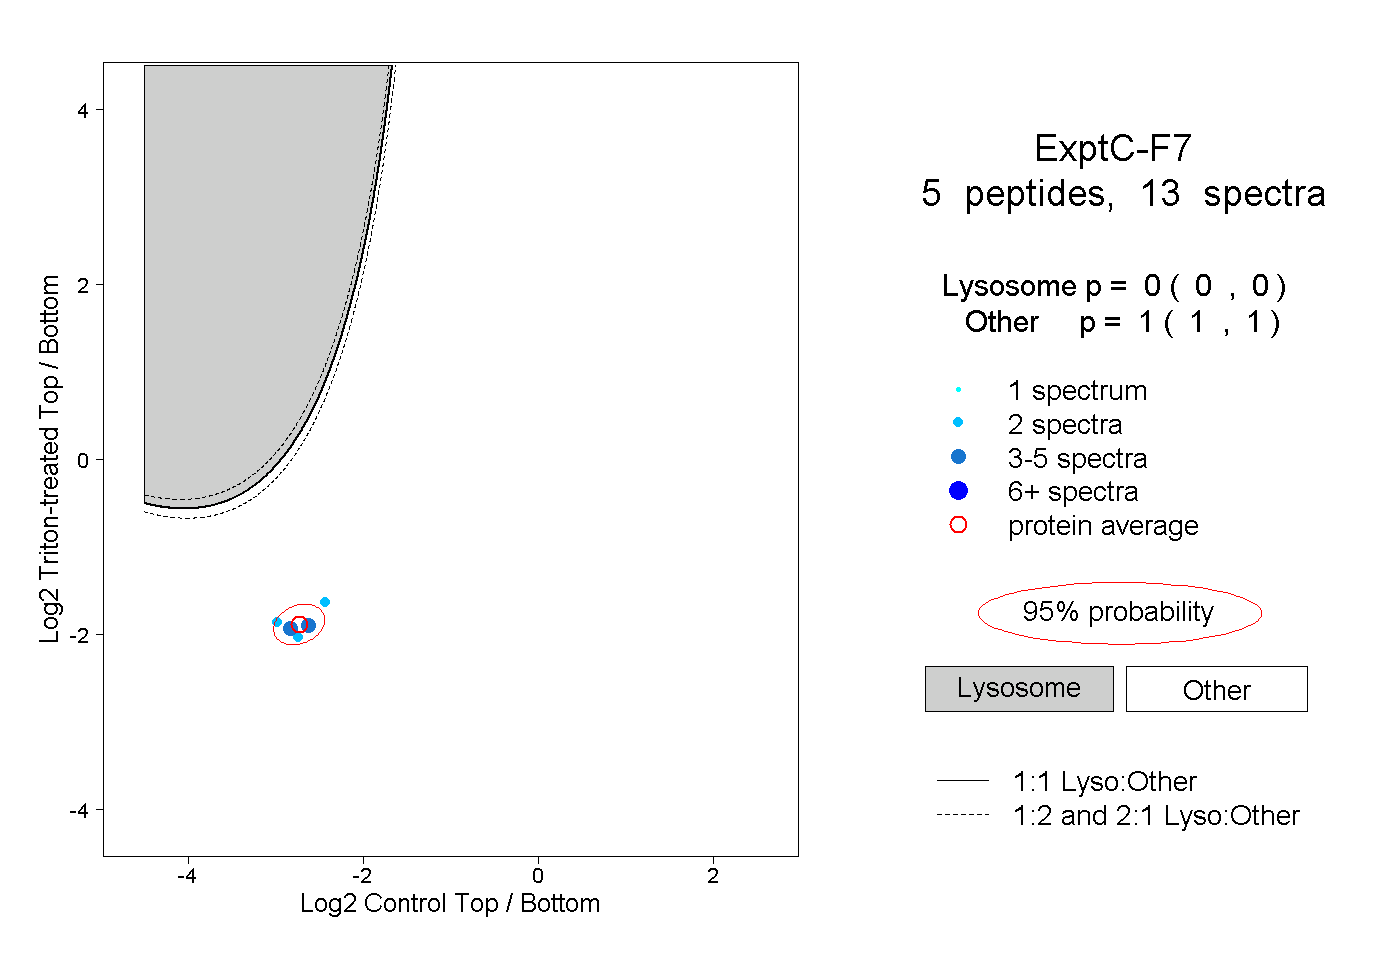
0.000 | 0.000
1.000 | 1.000
1peptide
spectrum

NA | NA
NA | NA