 5
5peptides
spectra
0.000 | 0.000
0.192 | 0.295
0.000 | 0.065
0.573 | 0.631
0.000 | 0.000
0.000 | 0.019
0.098 | 0.126
0.000 | 0.000
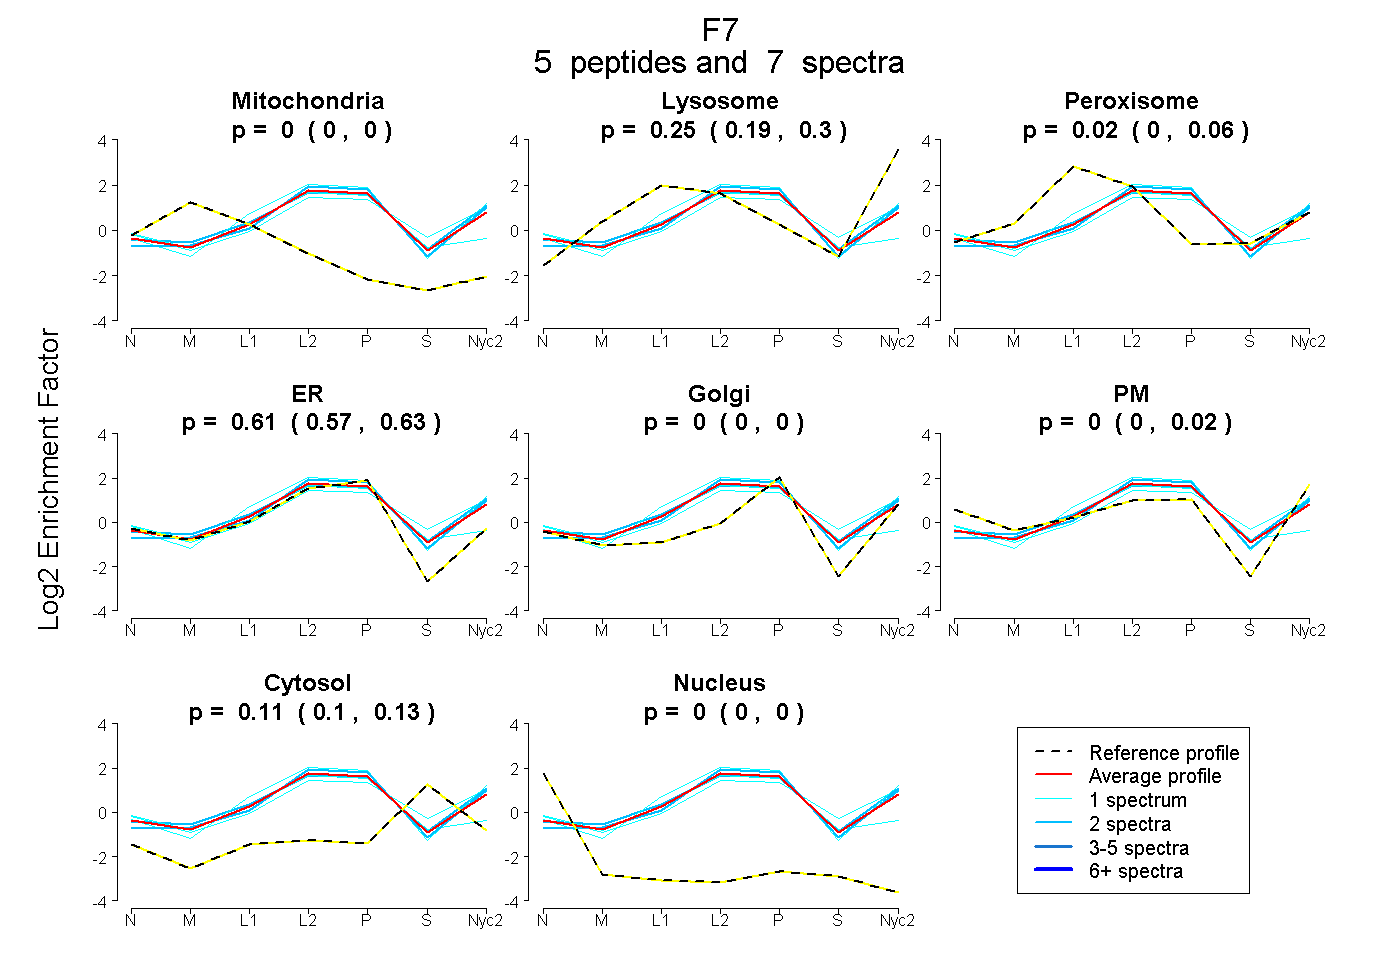
| Plot | Mito | Lyso | Perox | ER | Golgi | PM | Cytosol | Nucleus | |||||
| Expt A |
5 peptides |
7 spectra |
|
0.000 0.000 | 0.000 |
0.254 0.192 | 0.295 |
0.024 0.000 | 0.065 |
0.608 0.573 | 0.631 |
0.000 0.000 | 0.000 |
0.000 0.000 | 0.019 |
0.113 0.098 | 0.126 |
0.000 0.000 | 0.000 |
| 2 spectra, EGTEQVR | 0.000 | 0.335 | 0.002 | 0.545 | 0.000 | 0.012 | 0.106 | 0.000 | ||
| 1 spectrum, FNEALLCGAVLLDTR | 0.000 | 0.000 | 0.196 | 0.657 | 0.000 | 0.000 | 0.147 | 0.000 | ||
| 1 spectrum, DHVGTK | 0.000 | 0.244 | 0.000 | 0.377 | 0.000 | 0.154 | 0.225 | 0.000 | ||
| 2 spectra, VSGWGQLLDR | 0.000 | 0.289 | 0.000 | 0.637 | 0.000 | 0.000 | 0.074 | 0.000 | ||
| 1 spectrum, GATALELMVIEVPR | 0.000 | 0.325 | 0.000 | 0.644 | 0.000 | 0.000 | 0.030 | 0.000 |
| Plot | Mito | Lyso or Perox | ER | Golgi | PM | Cytosol | Nucleus | ||||||
| Expt B |
1 peptide |
1 spectrum |
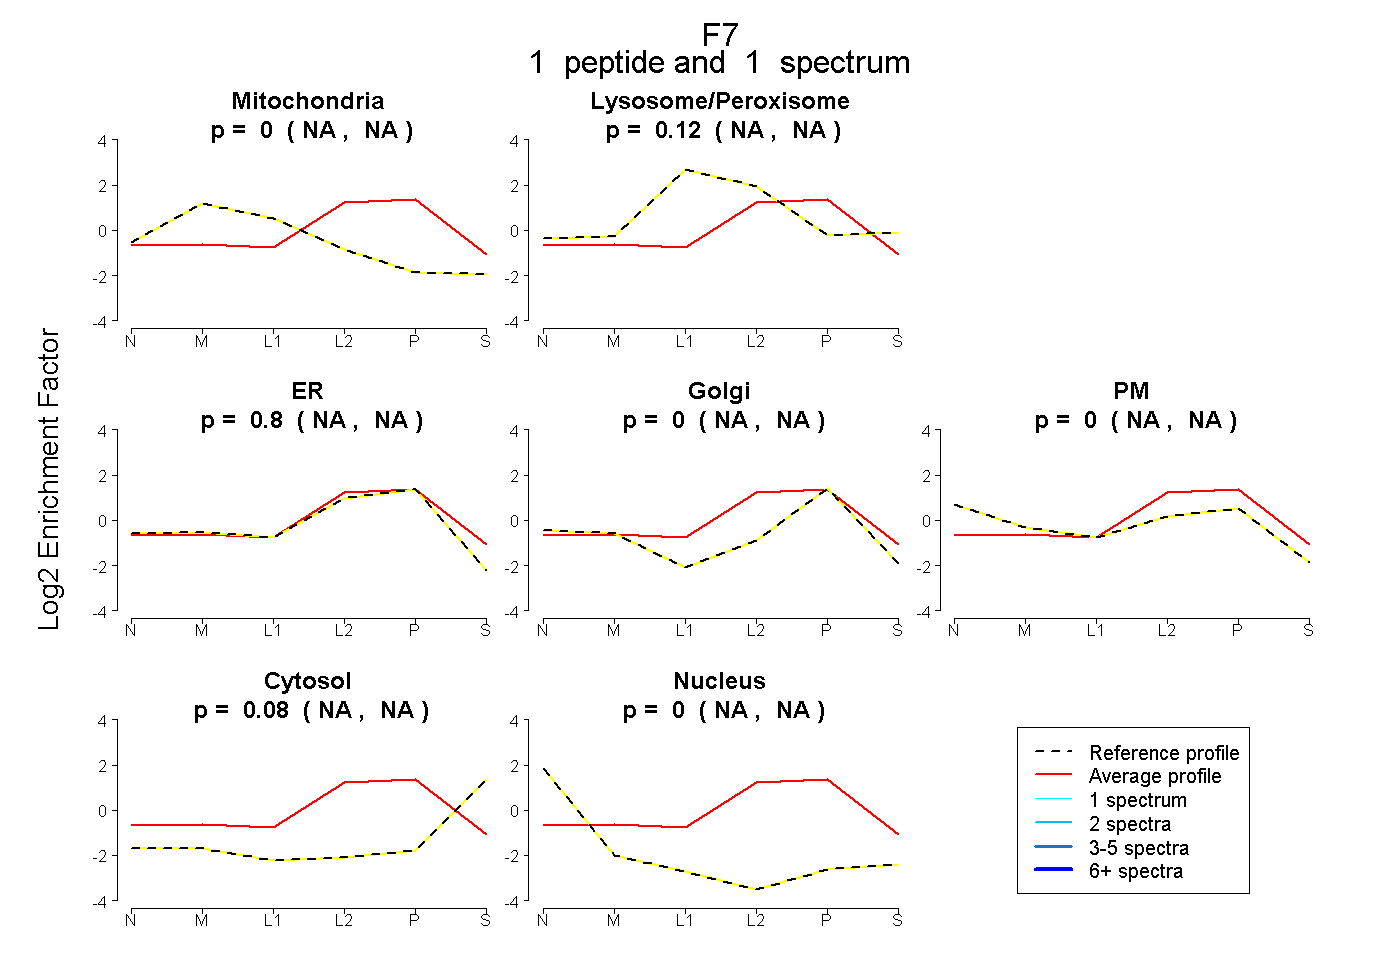 |
0.000 NA | NA |
0.116 NA | NA |
0.801 NA | NA |
0.000 NA | NA |
0.000 NA | NA |
0.083 NA | NA |
0.000 NA | NA |
|||
| Plot | Lyso | Other | |||||||||||
| Expt C |
5 peptides |
13 spectra |
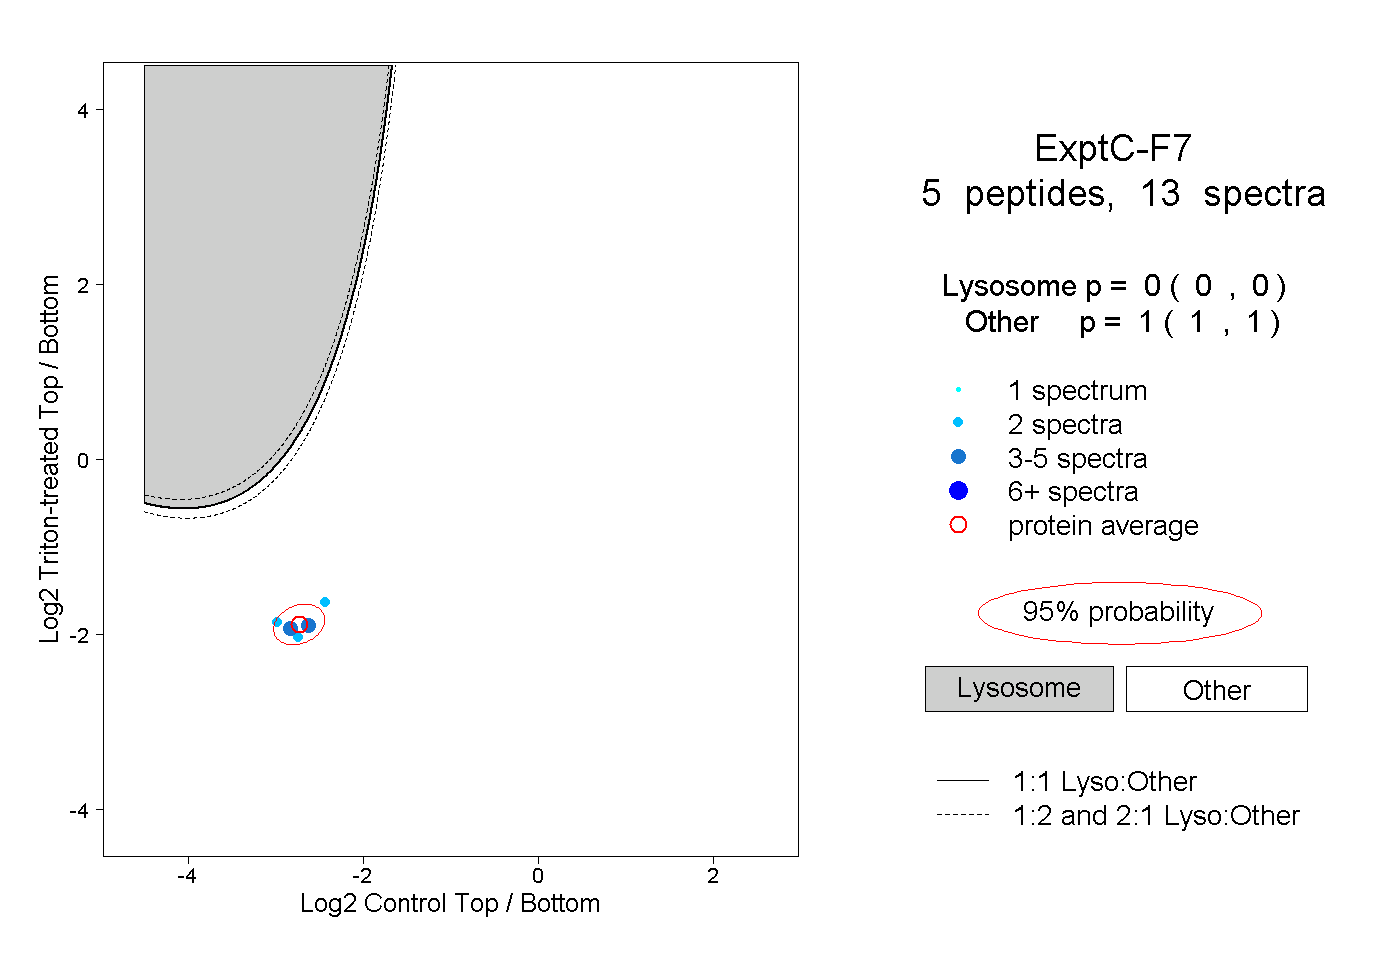 |
0.000 0.000 | 0.000 |
1.000 1.000 | 1.000 |
||||||||
| Plot | Lyso | Other | |||||||||||
| Expt D |
1 peptide |
1 spectrum |
 |
0.000 NA | NA |
1.000 NA | NA |