 8
8peptides
spectra
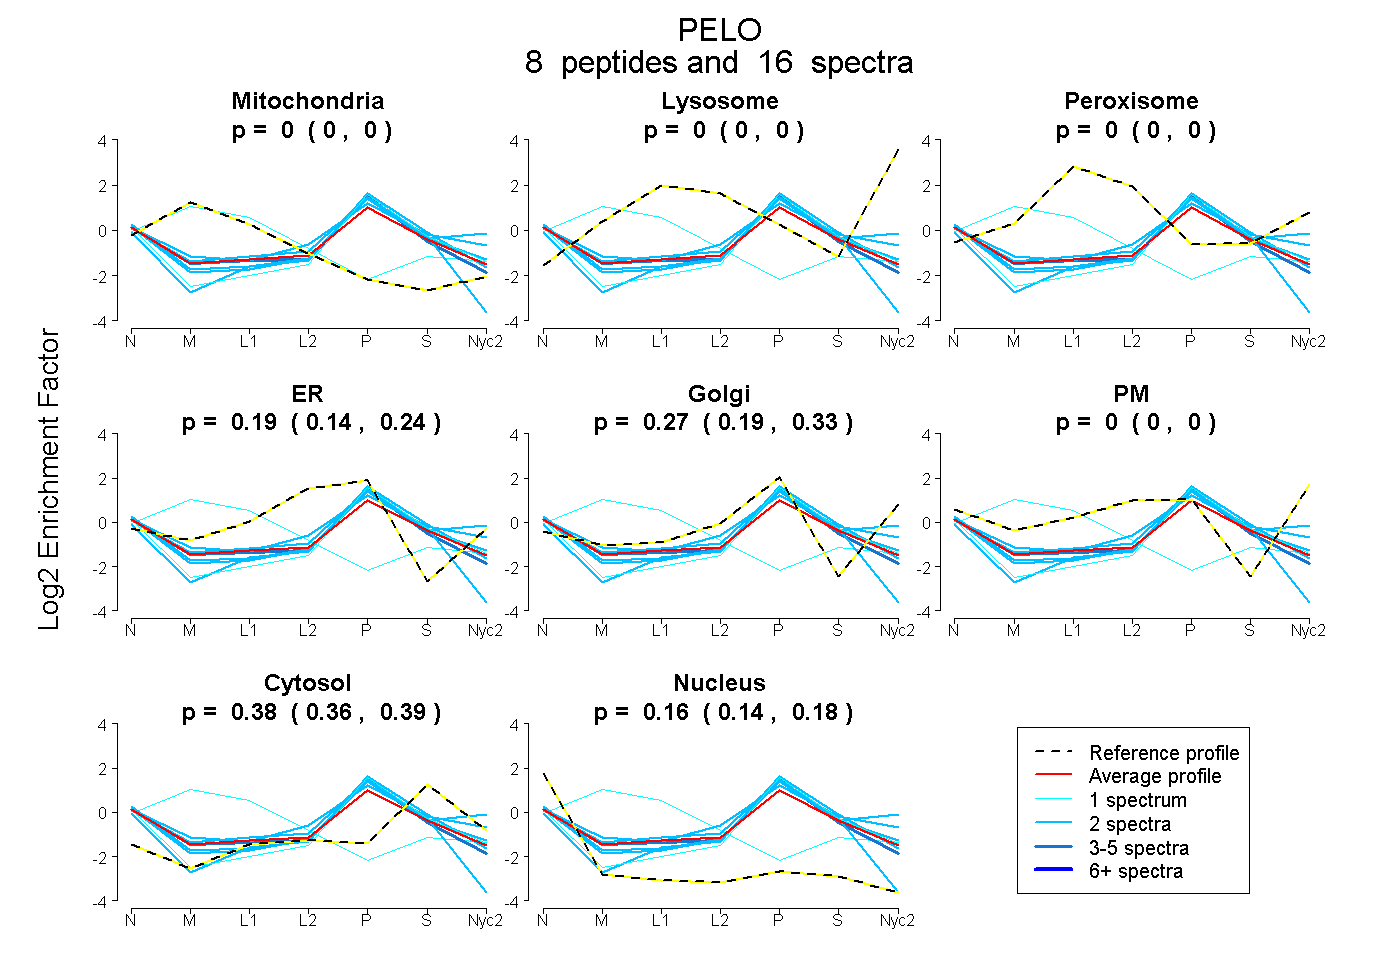
0.000 | 0.000
0.000 | 0.000
0.000 | 0.000
0.137 | 0.236
0.194 | 0.333
0.000 | 0.000
0.357 | 0.391
0.143 | 0.179
4peptides
spectra

0.000 | 0.119
0.150 | 0.307
0.000 | 0.000
0.248 | 0.530
0.052 | 0.332
0.050 | 0.171
0.000 | 0.000
4peptides
spectra
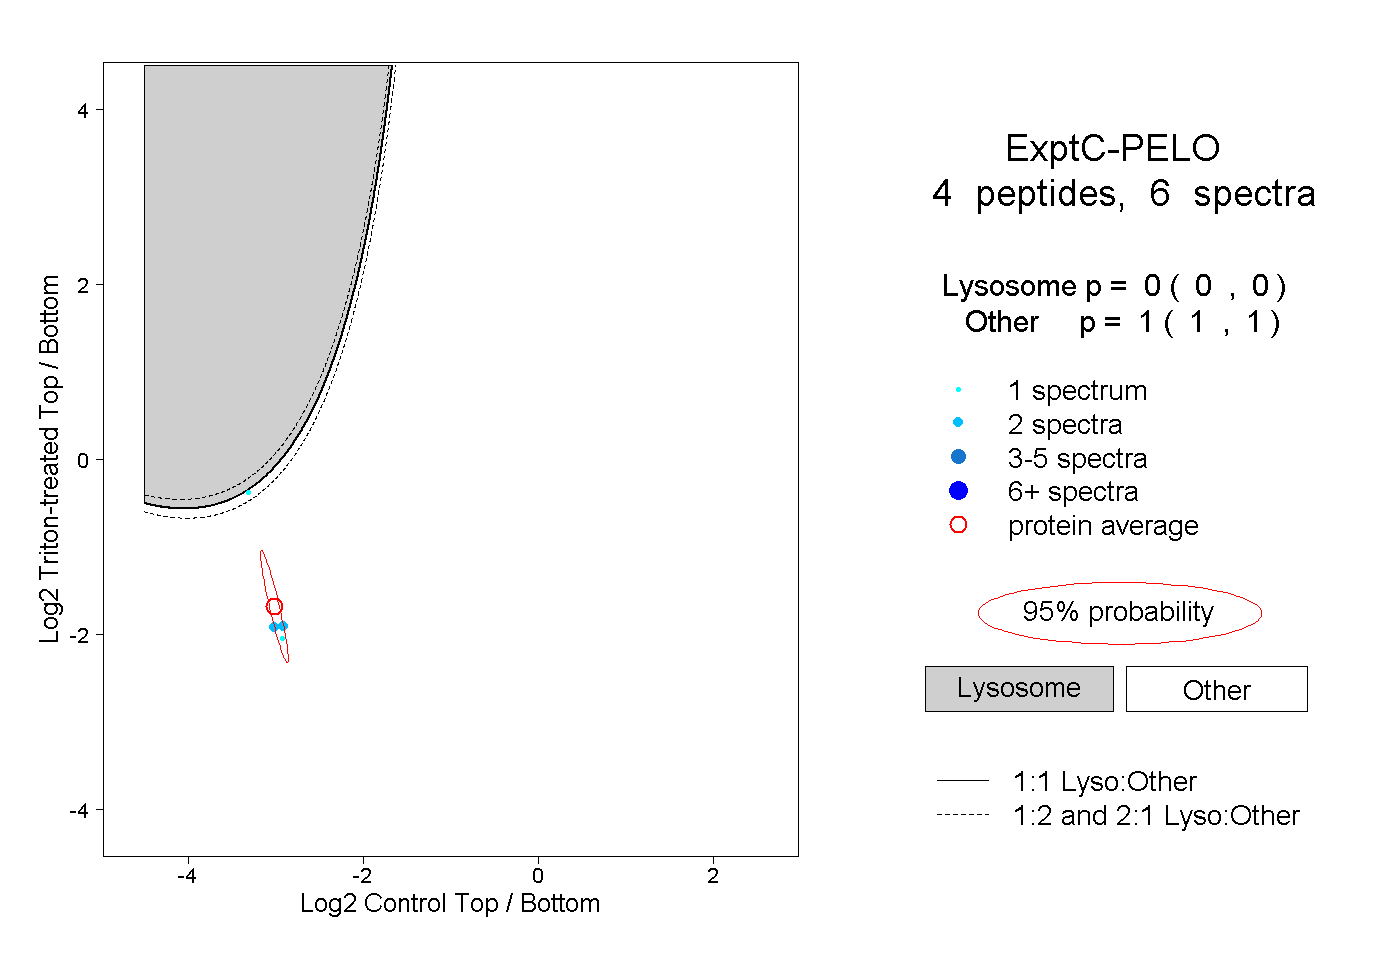
0.000 | 0.000
1.000 | 1.000