 8
8peptides
spectra
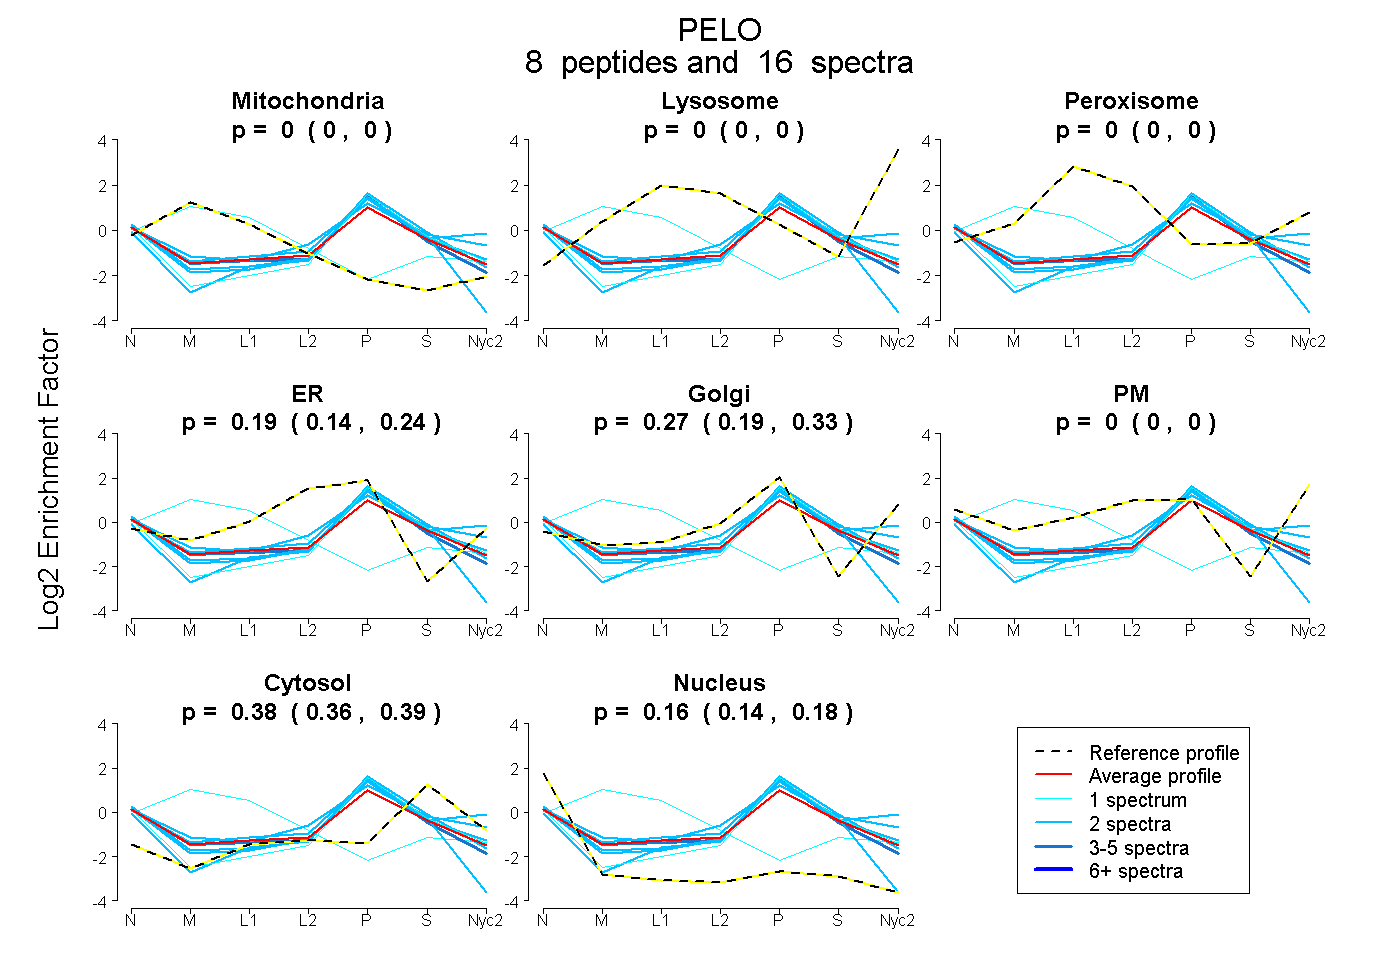
0.000 | 0.000
0.000 | 0.000
0.000 | 0.000
0.137 | 0.236
0.194 | 0.333
0.000 | 0.000
0.357 | 0.391
0.143 | 0.179
| Plot | Mito | Lyso | Perox | ER | Golgi | PM | Cytosol | Nucleus | |||||
| Expt A |
8 peptides |
16 spectra |
|
0.000 0.000 | 0.000 |
0.000 0.000 | 0.000 |
0.000 0.000 | 0.000 |
0.192 0.137 | 0.236 |
0.271 0.194 | 0.333 |
0.000 0.000 | 0.000 |
0.375 0.357 | 0.391 |
0.162 0.143 | 0.179 |
| 4 spectra, ALDDFYK | 0.000 | 0.000 | 0.000 | 0.185 | 0.312 | 0.000 | 0.317 | 0.186 | ||
| 1 spectrum, VQTESSTGSVGSNR | 0.000 | 0.000 | 0.000 | 0.000 | 0.452 | 0.000 | 0.365 | 0.182 | ||
| 2 spectra, HQDVATR | 0.000 | 0.000 | 0.000 | 0.132 | 0.429 | 0.000 | 0.391 | 0.048 | ||
| 1 spectrum, AAGEVK | 0.707 | 0.000 | 0.158 | 0.000 | 0.000 | 0.000 | 0.135 | 0.000 | ||
| 2 spectra, VLLENR | 0.000 | 0.000 | 0.000 | 0.006 | 0.502 | 0.000 | 0.333 | 0.160 | ||
| 2 spectra, CILVASPGFVR | 0.000 | 0.000 | 0.000 | 0.000 | 0.626 | 0.000 | 0.354 | 0.019 | ||
| 2 spectra, EVLCDPTVASR | 0.000 | 0.000 | 0.000 | 0.357 | 0.000 | 0.000 | 0.321 | 0.323 | ||
| 2 spectra, GTNIQENEYVK | 0.000 | 0.000 | 0.000 | 0.004 | 0.422 | 0.000 | 0.428 | 0.145 |
| Plot | Mito | Lyso or Perox | ER | Golgi | PM | Cytosol | Nucleus | ||||||
| Expt B |
4 peptides |
5 spectra |
 |
0.027 0.000 | 0.119 |
0.232 0.150 | 0.307 |
0.000 0.000 | 0.000 |
0.397 0.248 | 0.530 |
0.222 0.052 | 0.332 |
0.121 0.050 | 0.171 |
0.000 0.000 | 0.000 |
|||
| Plot | Lyso | Other | |||||||||||
| Expt C |
4 peptides |
6 spectra |
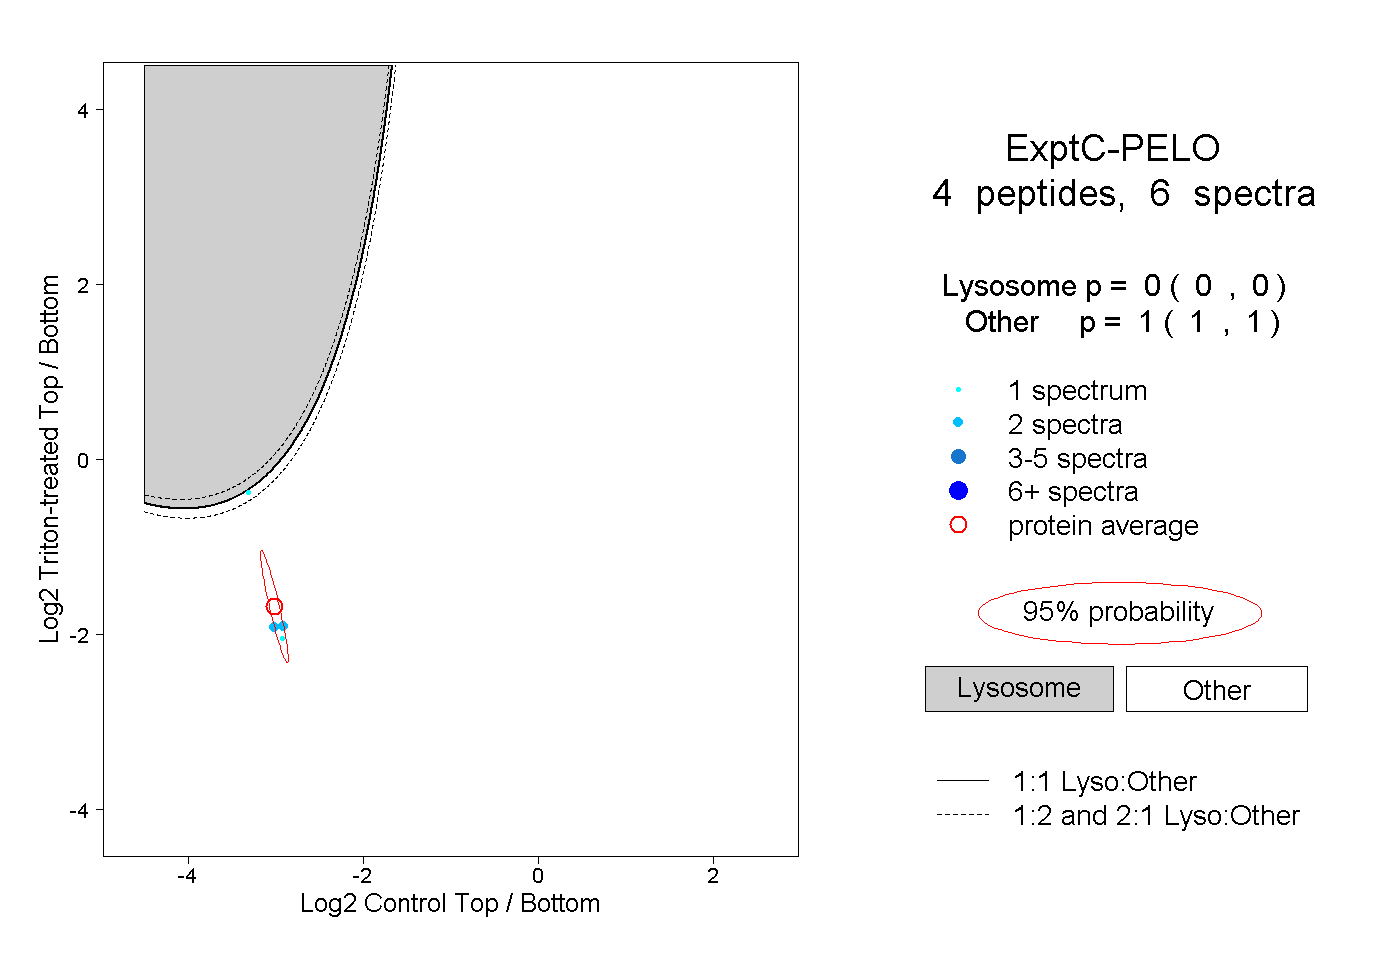 |
0.000 0.000 | 0.000 |
1.000 1.000 | 1.000 |