 6
6peptides
spectra
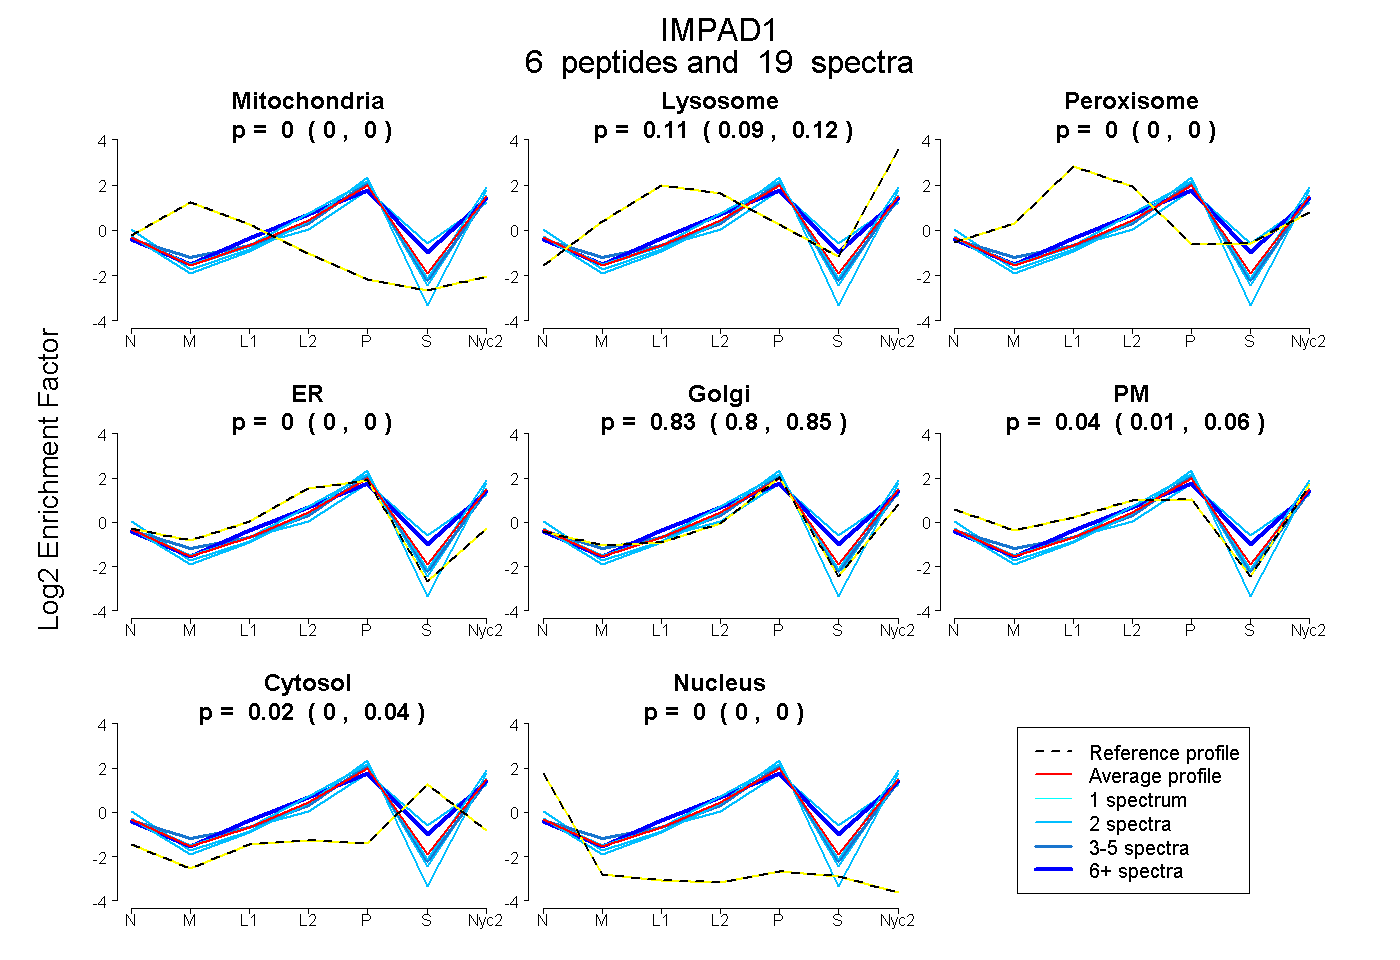
0.000 | 0.000
0.092 | 0.123
0.000 | 0.000
0.000 | 0.000
0.801 | 0.852
0.008 | 0.063
0.003 | 0.041
0.000 | 0.000
9peptides
spectra
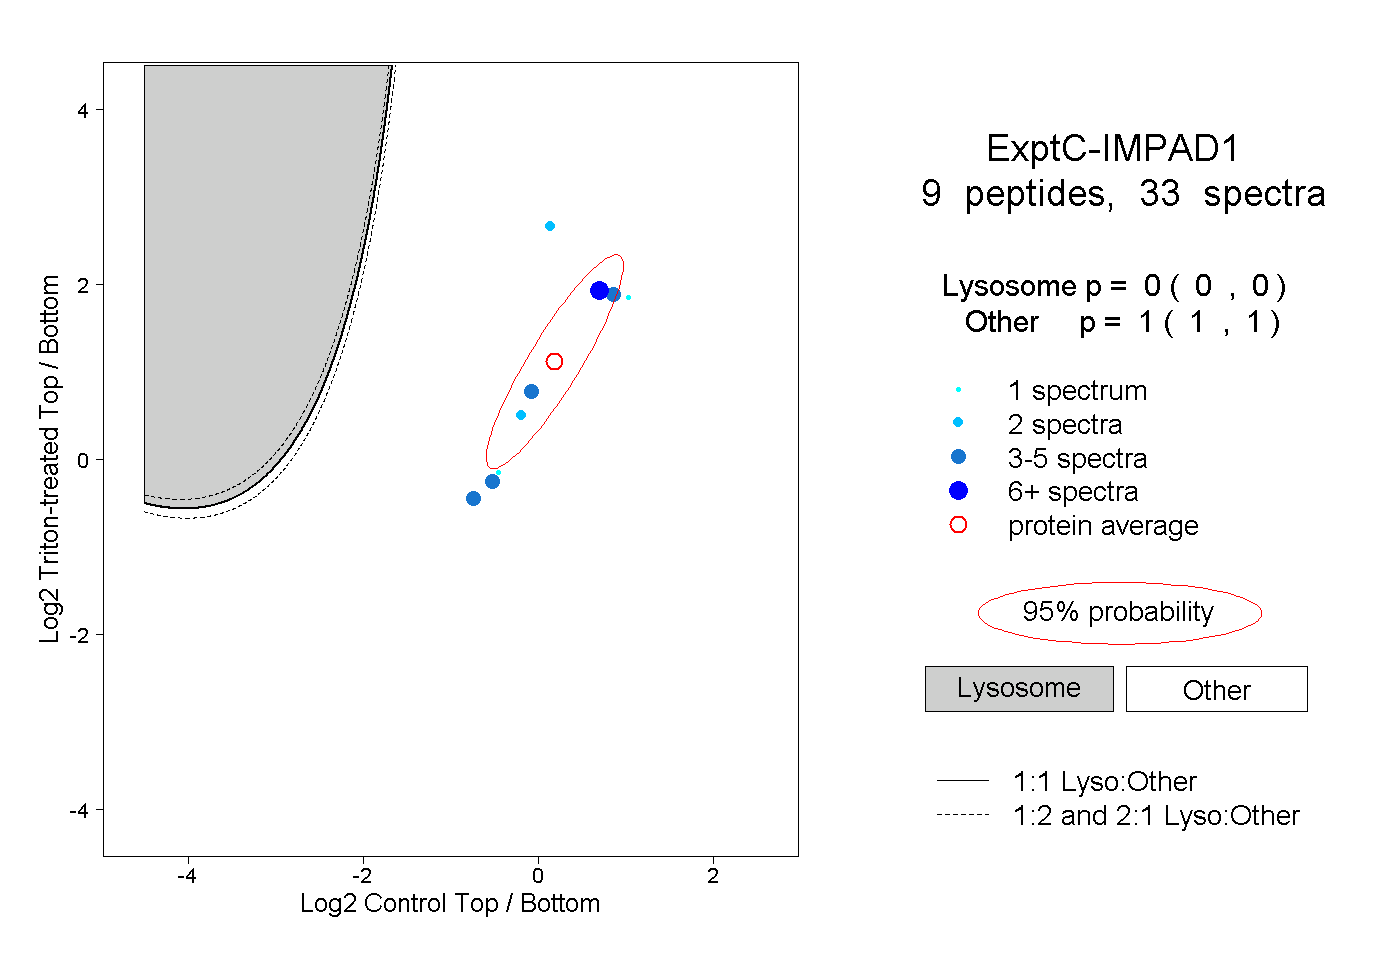
0.000 | 0.000
1.000 | 1.000
1peptide
spectrum
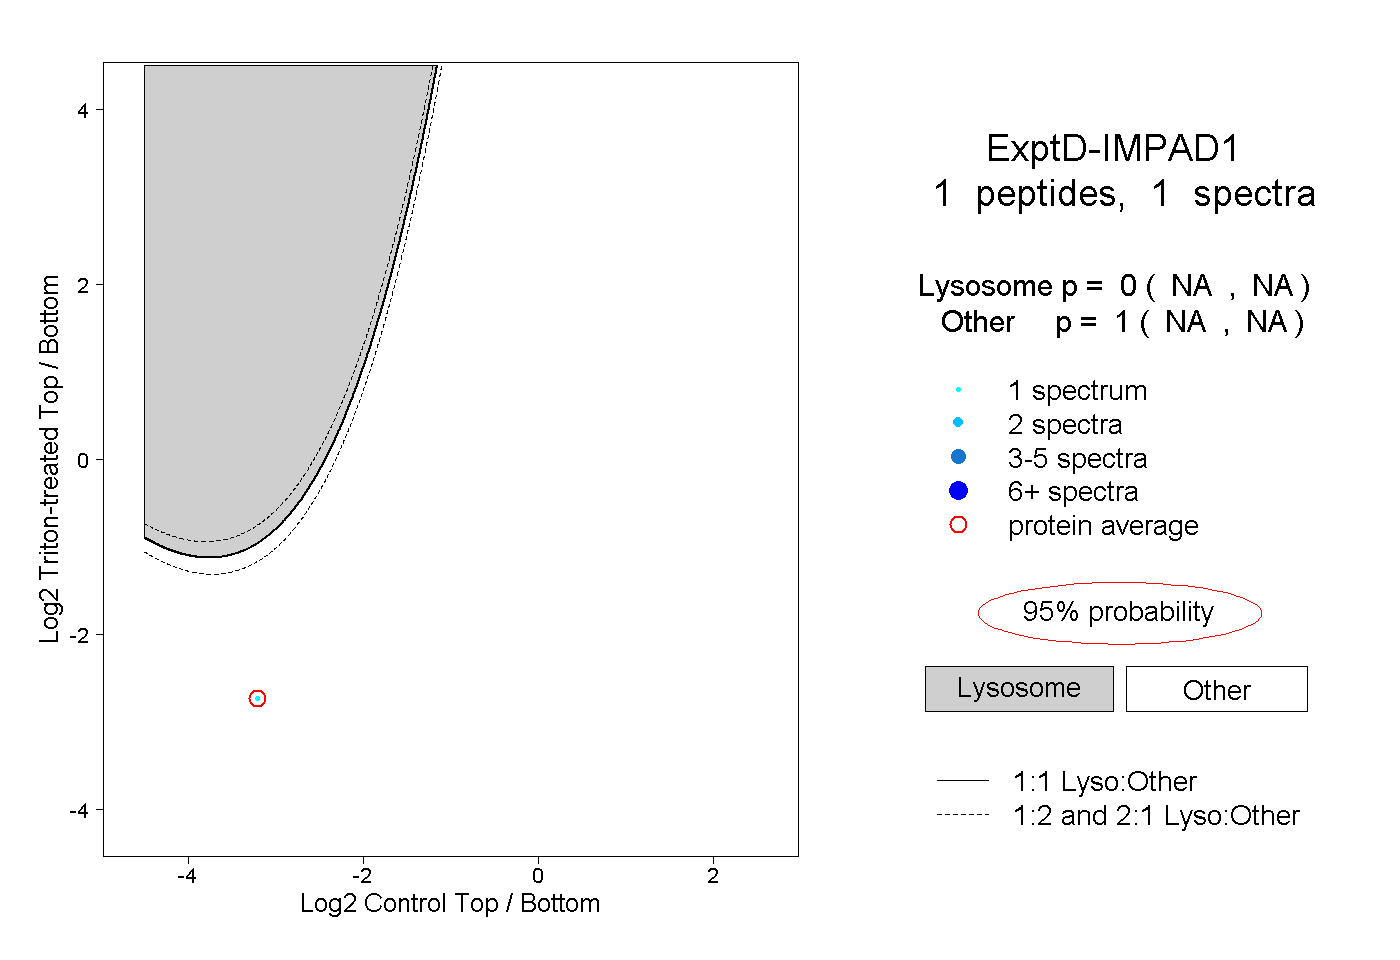
NA | NA
NA | NA