 6
6peptides
spectra
0.000 | 0.000
0.092 | 0.123
0.000 | 0.000
0.000 | 0.000
0.801 | 0.852
0.008 | 0.063
0.003 | 0.041
0.000 | 0.000
9peptides
spectra
0.000 | 0.000
1.000 | 1.000
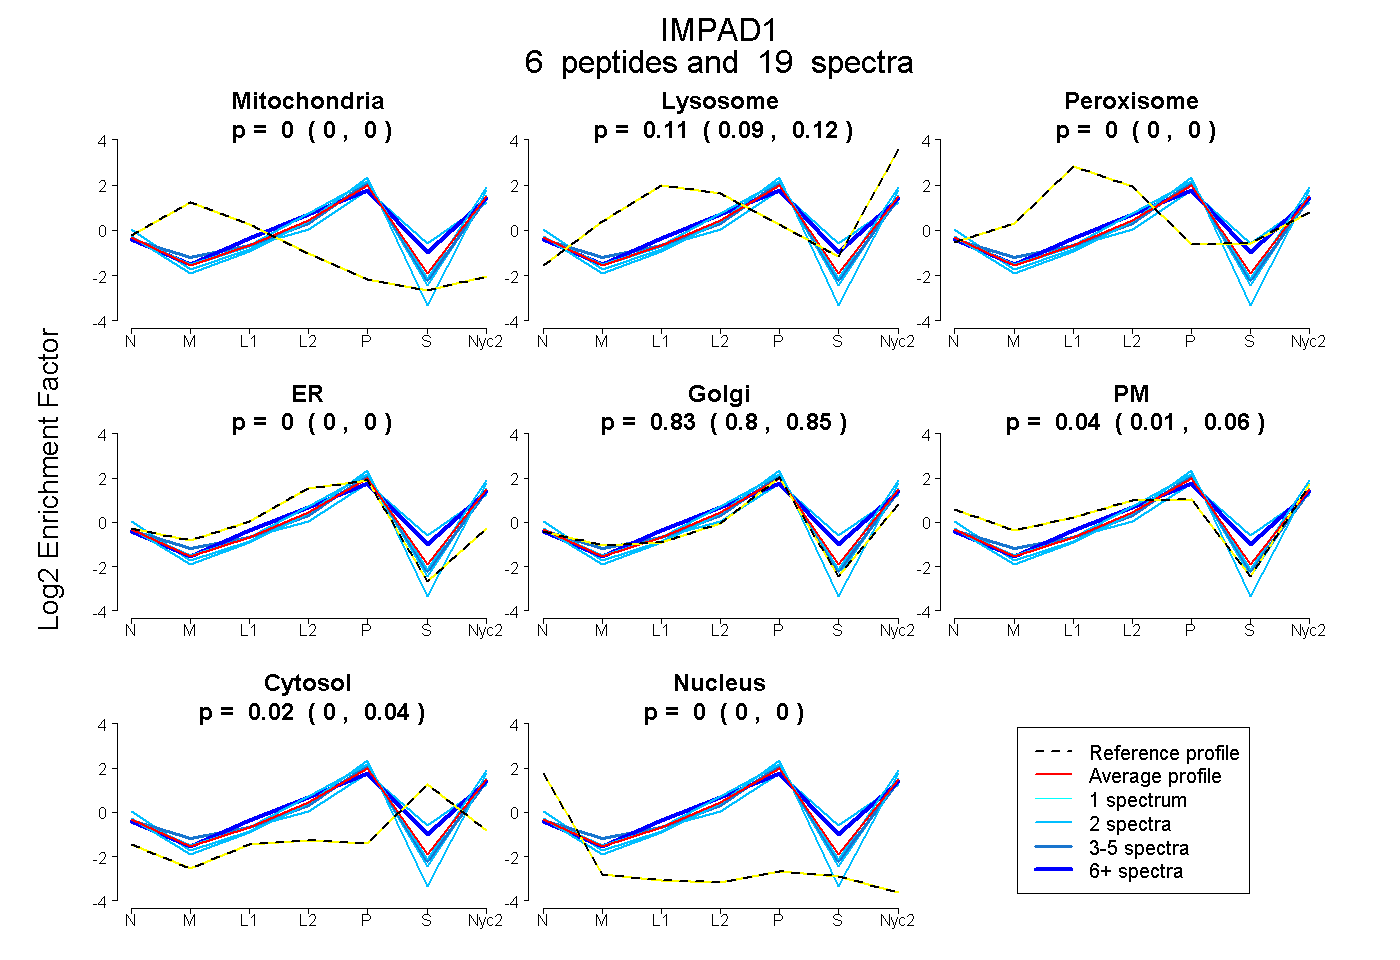
| Plot | Mito | Lyso | Perox | ER | Golgi | PM | Cytosol | Nucleus | |||||
| Expt A |
6 peptides |
19 spectra |
|
0.000 0.000 | 0.000 |
0.109 0.092 | 0.123 |
0.000 0.000 | 0.000 |
0.000 0.000 | 0.000 |
0.828 0.801 | 0.852 |
0.038 0.008 | 0.063 |
0.024 0.003 | 0.041 |
0.000 0.000 | 0.000 |
||
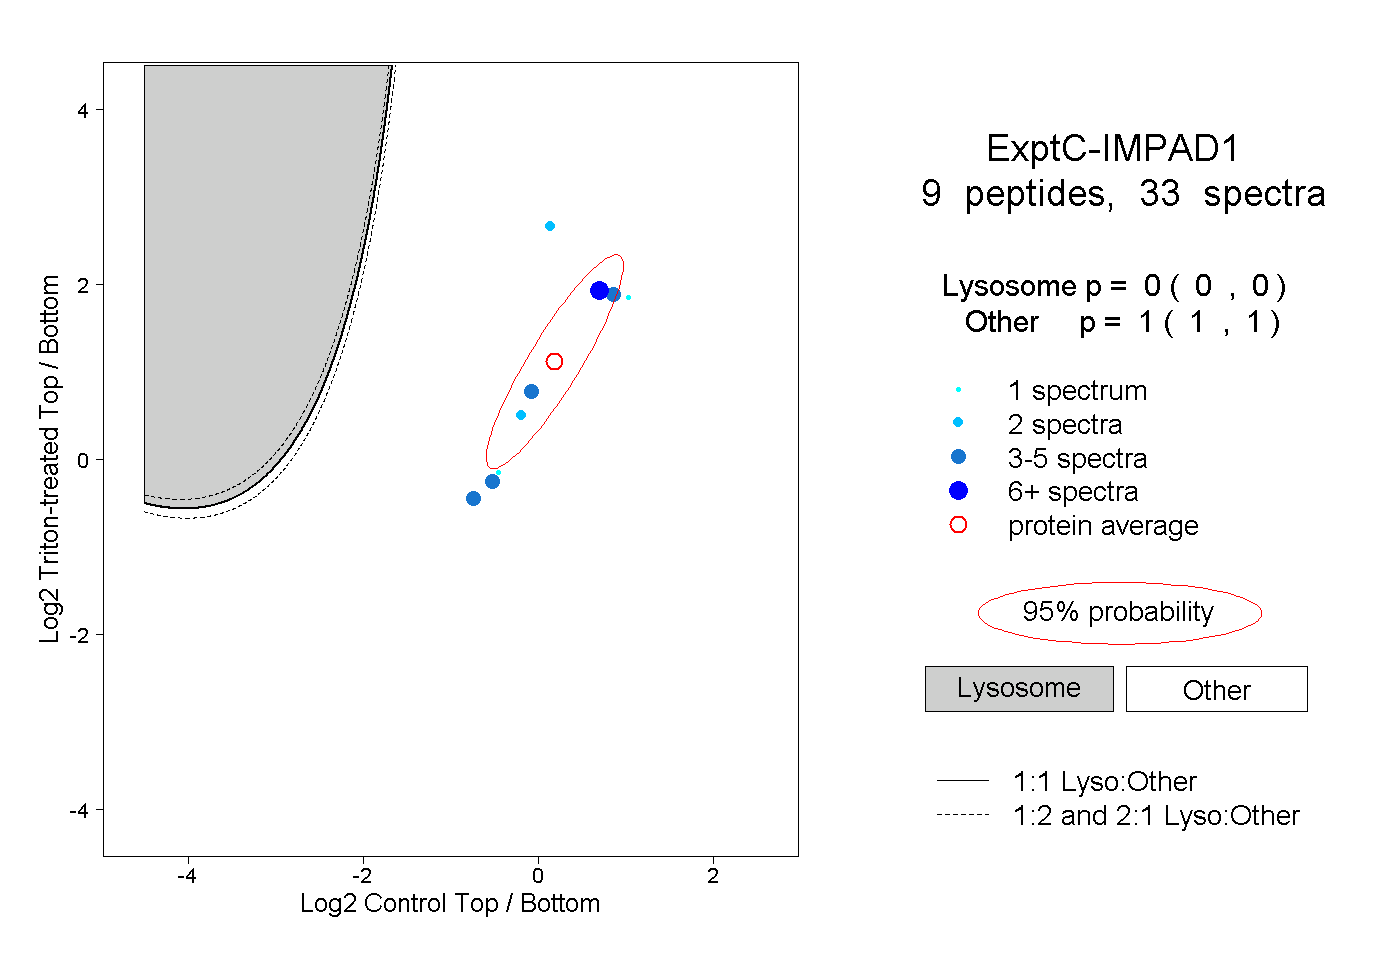
| Plot | Lyso | Other | |||||||||||
| Expt C |
9 peptides |
33 spectra |
|
0.000 0.000 | 0.000 |
1.000 1.000 | 1.000 |
| 3 spectra, MTSGDVLSNR | 0.000 | 1.000 | ||||||||
| 1 spectrum, MNHQALVR | 0.000 | 1.000 | ||||||||
| 5 spectra, MFYLLK | 0.000 | 1.000 | ||||||||
| 2 spectra, EMLAVAVLAAER | 0.000 | 1.000 | ||||||||
| 1 spectrum, ESNVLHEK | 0.000 | 1.000 | ||||||||
| 5 spectra, SHAGMVK | 0.000 | 1.000 | ||||||||
| 10 spectra, SSYNEK | 0.000 | 1.000 | ||||||||
| 4 spectra, EGAEDK | 0.000 | 1.000 | ||||||||
| 2 spectra, EIAAPK | 0.000 | 1.000 |
| Plot | Lyso | Other | |||||||||||
| Expt D |
1 peptide |
1 spectrum |
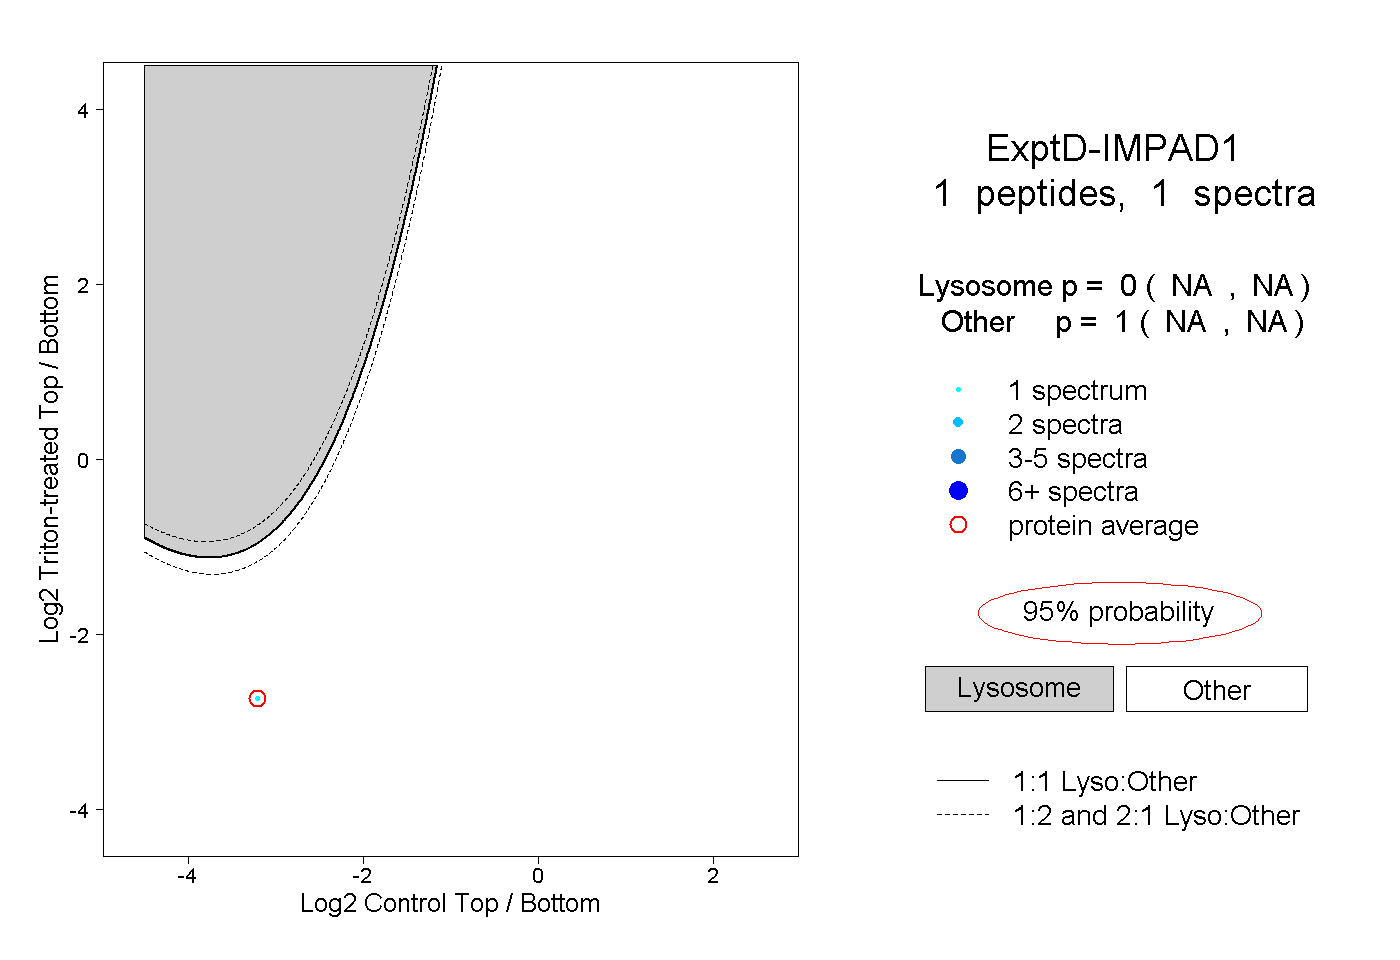 |
0.000 NA | NA |
1.000 NA | NA |