 5
5peptides
spectra
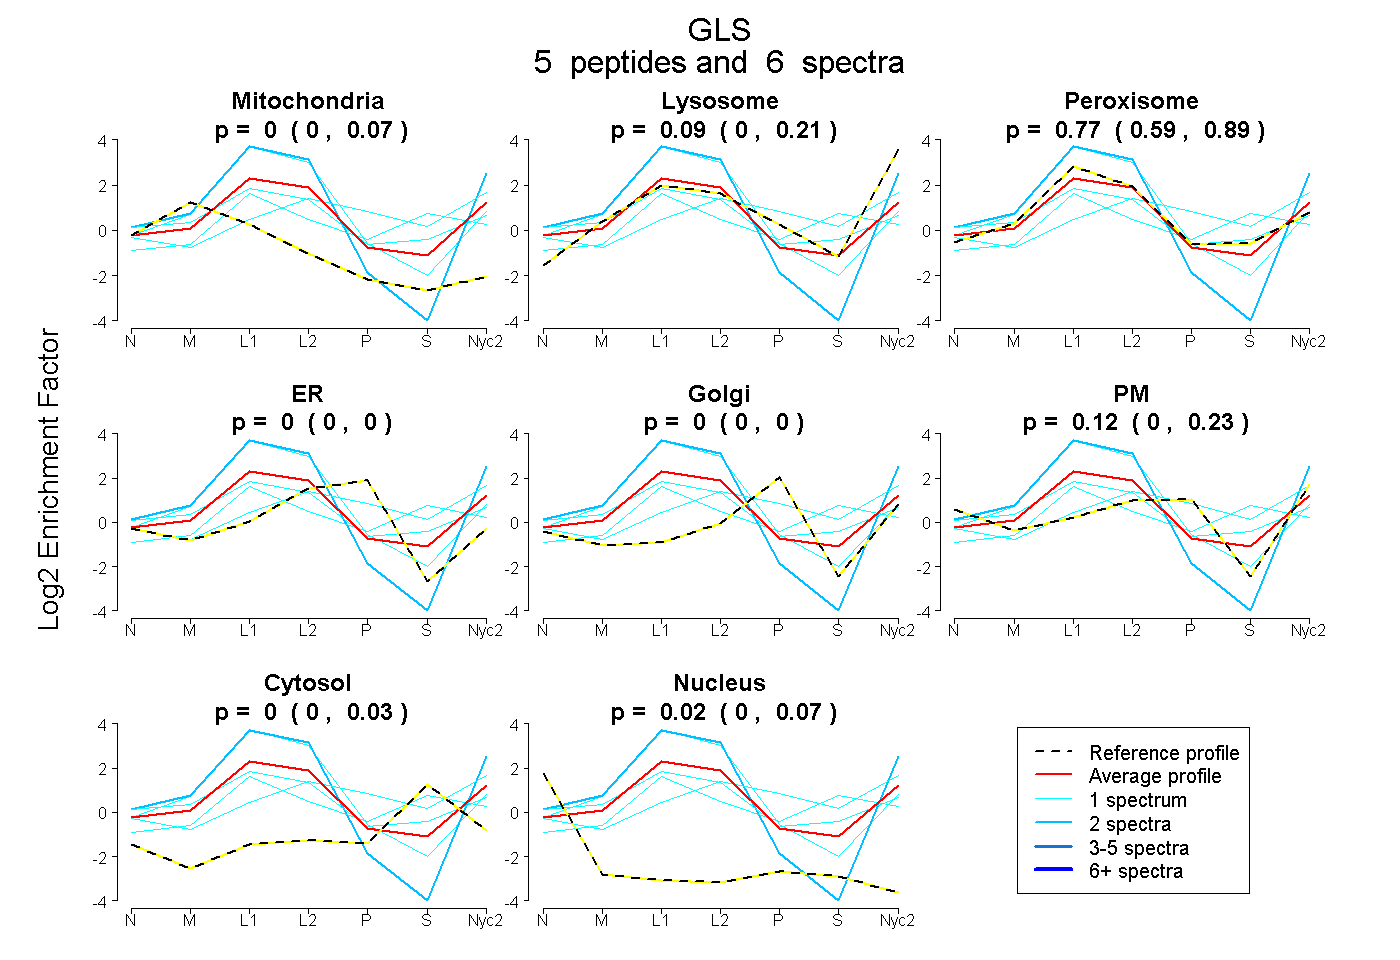
0.000 | 0.073
0.000 | 0.208
0.590 | 0.886
0.000 | 0.002
0.000 | 0.000
0.000 | 0.233
0.000 | 0.029
0.000 | 0.065
2peptides
spectra
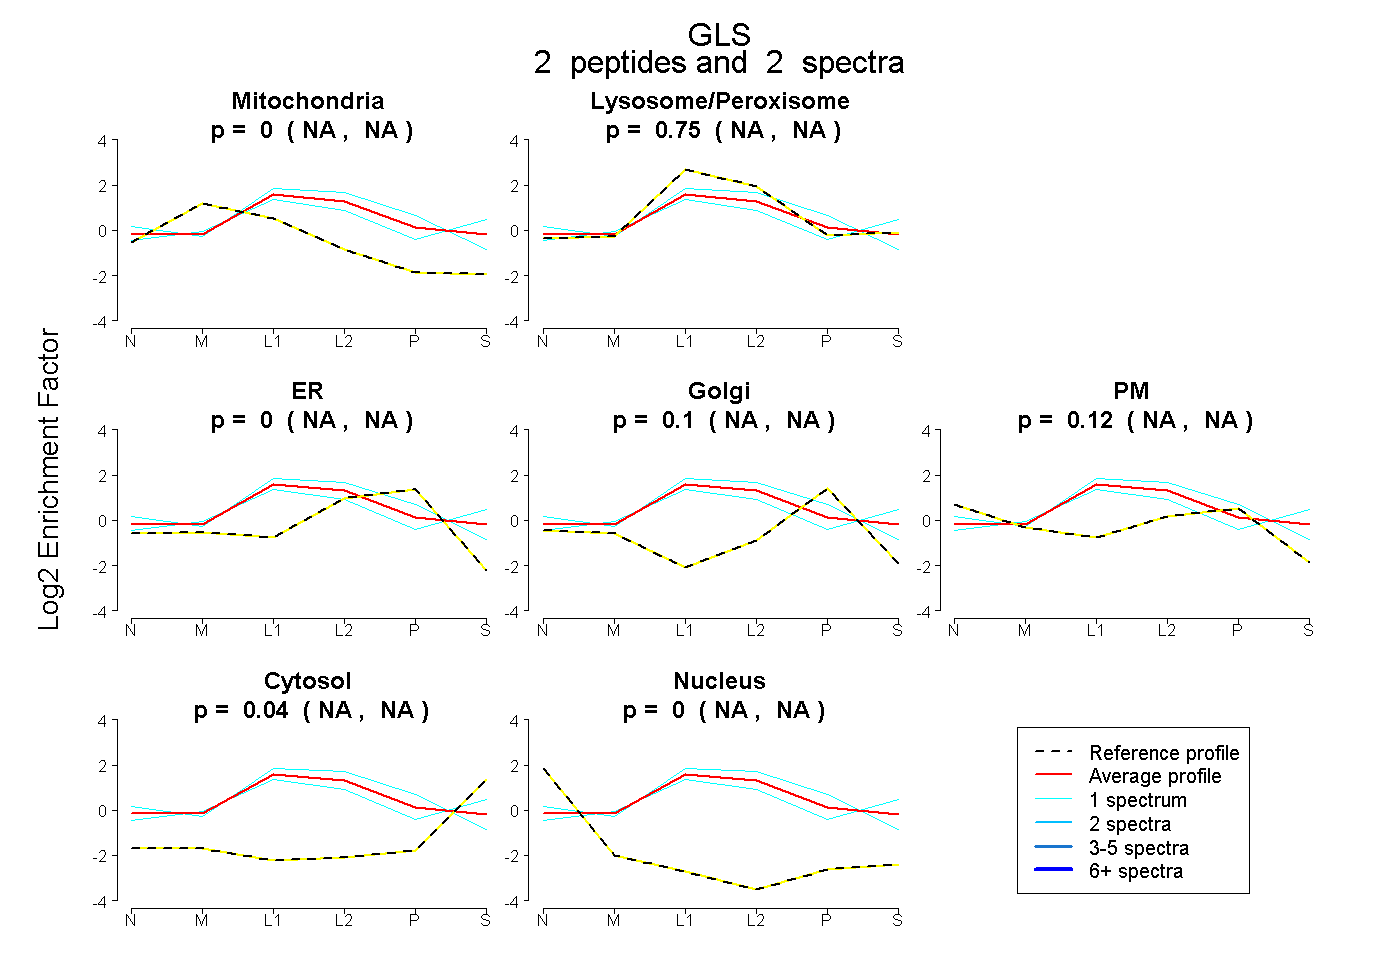
NA | NA
NA | NA
NA | NA
NA | NA
NA | NA
NA | NA
NA | NA
15peptides
spectra
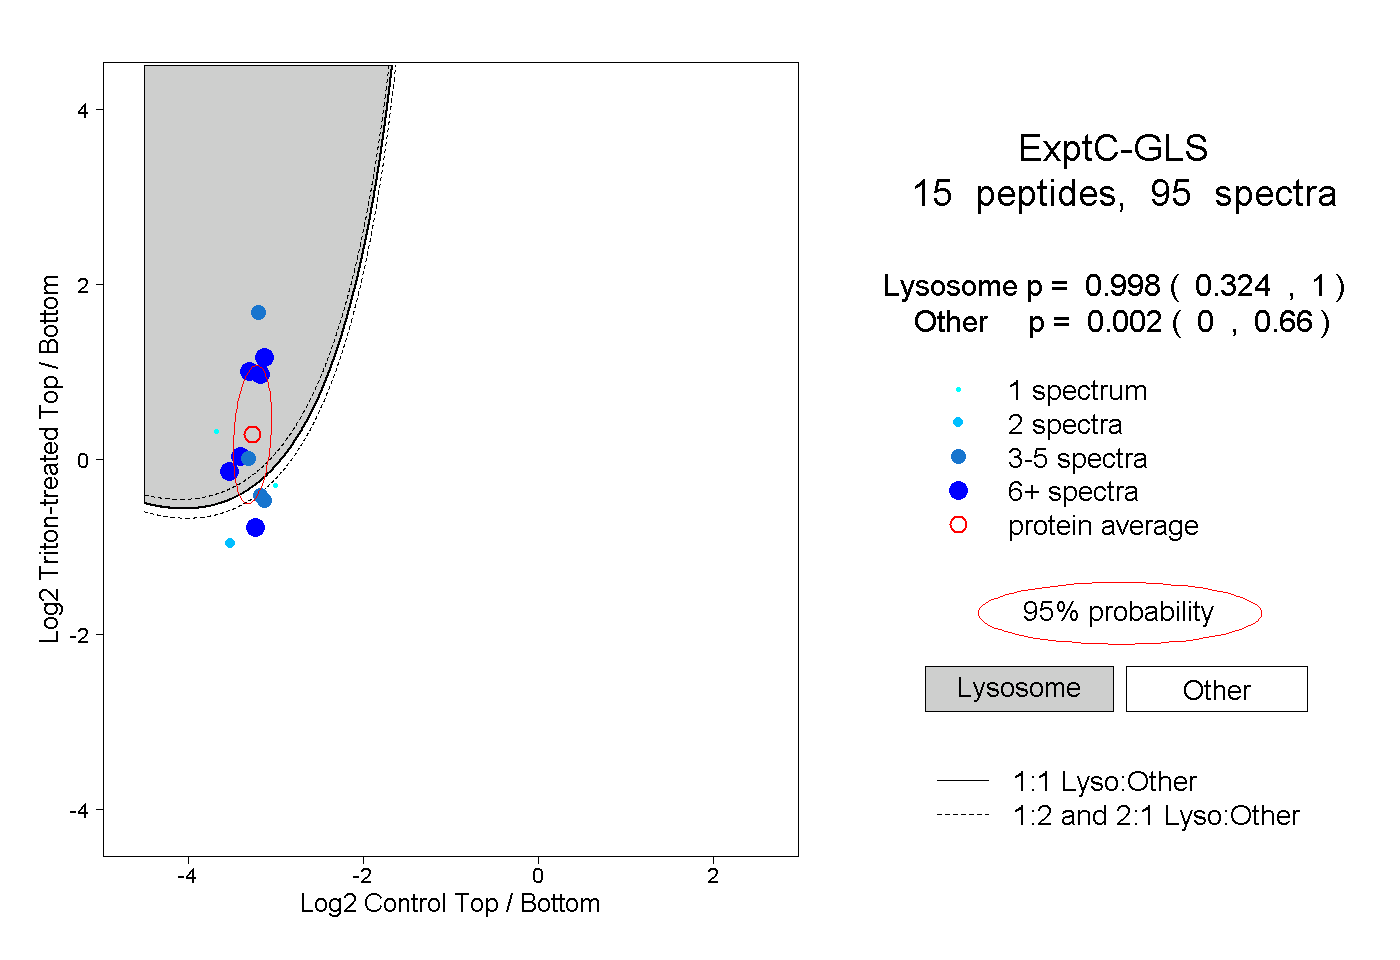
0.324 | 1.000
0.000 | 0.660
3peptides
spectra

0.000 | 0.012
0.987 | 1.000