 5
5peptides
spectra
0.000 | 0.073
0.000 | 0.208
0.590 | 0.886
0.000 | 0.002
0.000 | 0.000
0.000 | 0.233
0.000 | 0.029
0.000 | 0.065
| Plot | Mito | Lyso | Perox | ER | Golgi | PM | Cytosol | Nucleus | |||||
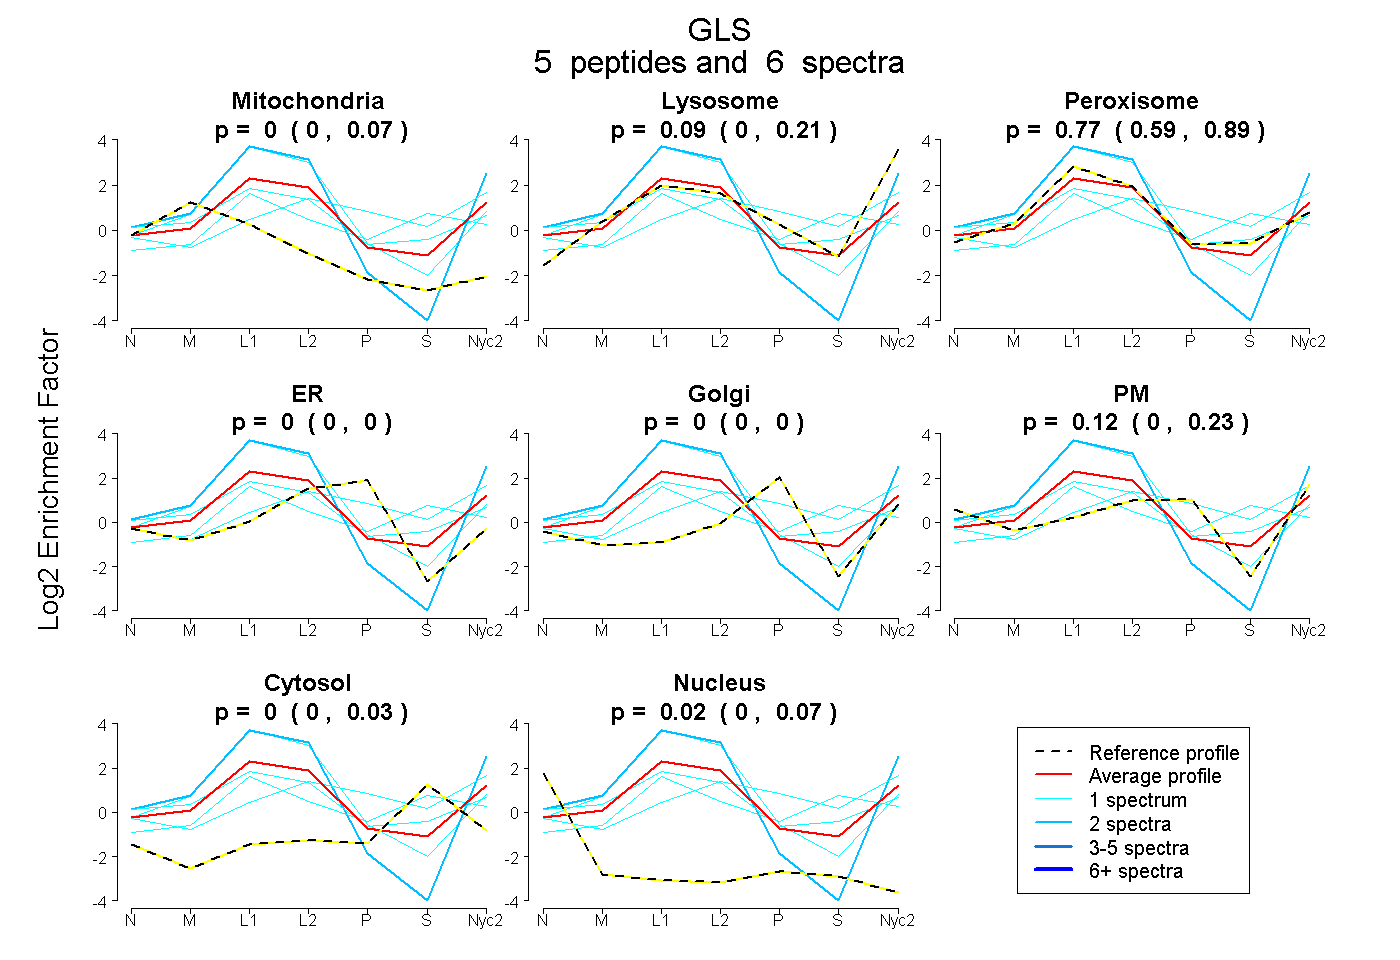
| Expt A |
5 peptides |
6 spectra |
|
0.000 0.000 | 0.073 |
0.086 0.000 | 0.208 |
0.772 0.590 | 0.886 |
0.000 0.000 | 0.002 |
0.000 0.000 | 0.000 |
0.118 0.000 | 0.233 |
0.000 0.000 | 0.029 |
0.024 0.000 | 0.065 |
| 1 spectrum, YAIAVNDLGTEYVHR | 0.000 | 0.000 | 0.641 | 0.000 | 0.000 | 0.000 | 0.359 | 0.000 | ||
| 1 spectrum, MGNSVK | 0.039 | 0.000 | 0.763 | 0.000 | 0.000 | 0.111 | 0.062 | 0.025 | ||
| 1 spectrum, CVQSNIVLLTQAFR | 0.000 | 0.000 | 1.000 | 0.000 | 0.000 | 0.000 | 0.000 | 0.000 | ||
| 1 spectrum, VSPESSDDTSTTIVYR | 0.000 | 0.354 | 0.092 | 0.085 | 0.000 | 0.227 | 0.242 | 0.000 | ||
| 2 spectra, FITALK | 0.023 | 0.366 | 0.587 | 0.000 | 0.000 | 0.024 | 0.000 | 0.000 |
| Plot | Mito | Lyso or Perox | ER | Golgi | PM | Cytosol | Nucleus | ||||||
| Expt B |
2 peptides |
2 spectra |
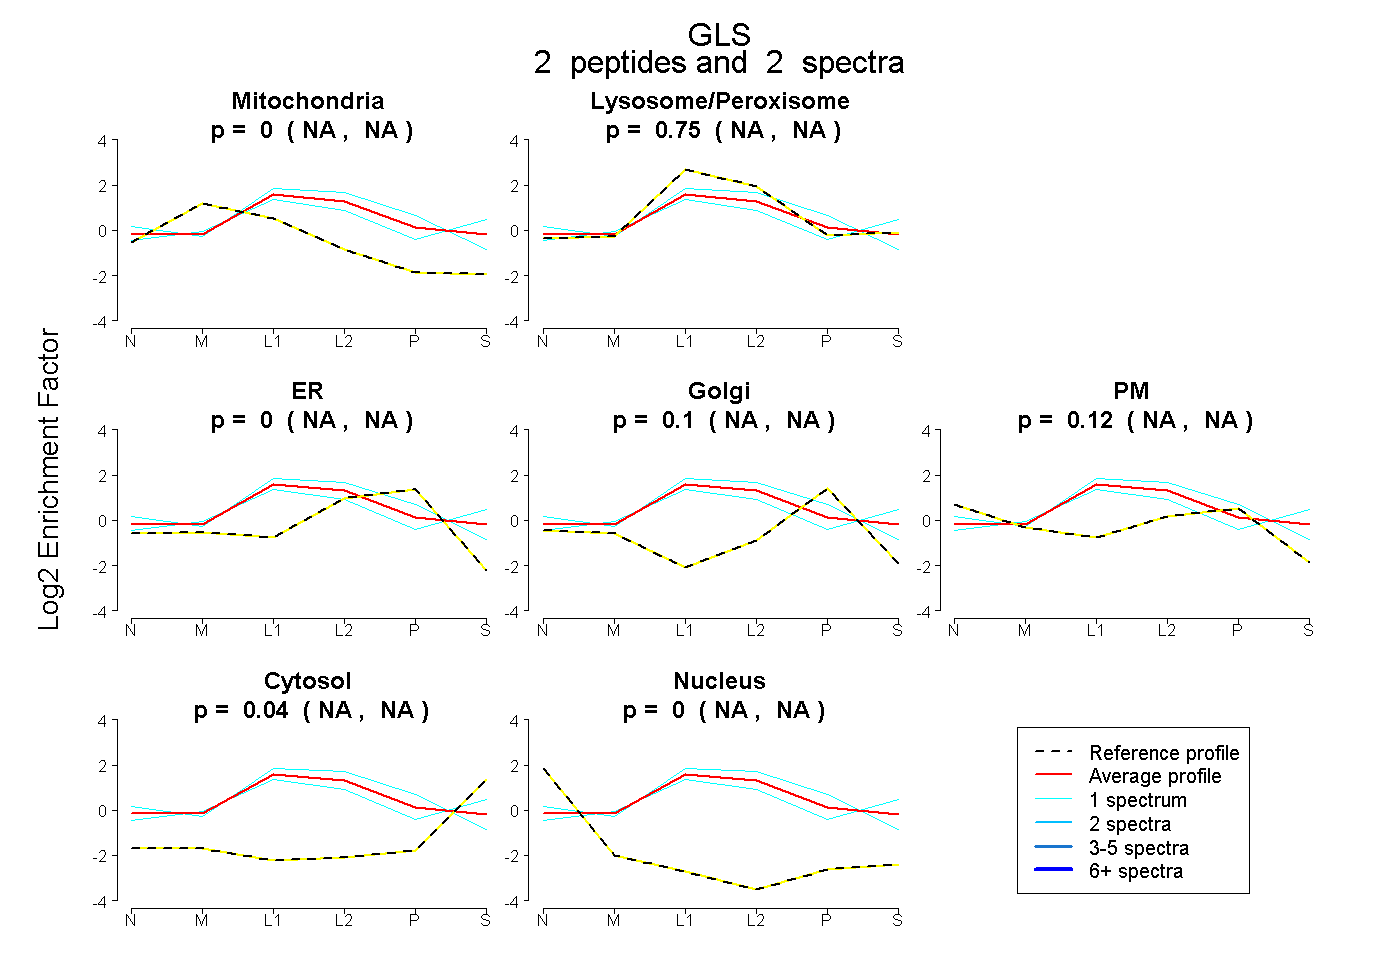 |
0.000 NA | NA |
0.749 NA | NA |
0.000 NA | NA |
0.100 NA | NA |
0.116 NA | NA |
0.035 NA | NA |
0.000 NA | NA |
|||
| Plot | Lyso | Other | |||||||||||
| Expt C |
15 peptides |
95 spectra |
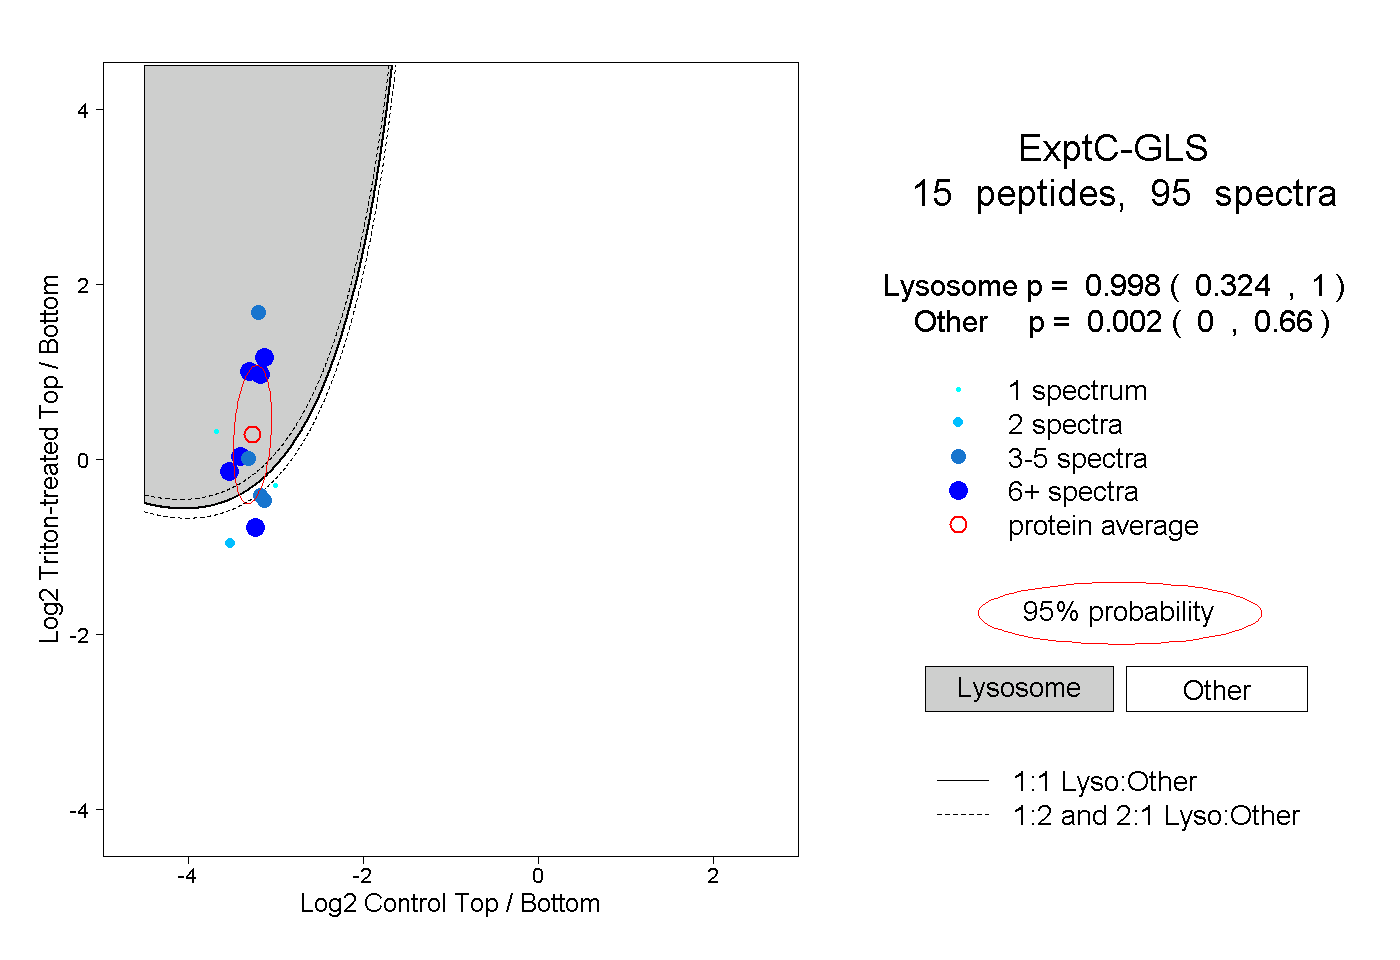 |
0.998 0.324 | 1.000 |
0.002 0.000 | 0.660 |
||||||||
| Plot | Lyso | Other | |||||||||||
| Expt D |
3 peptides |
7 spectra |
 |
0.000 0.000 | 0.012 |
1.000 0.987 | 1.000 |