 12
12peptides
spectra
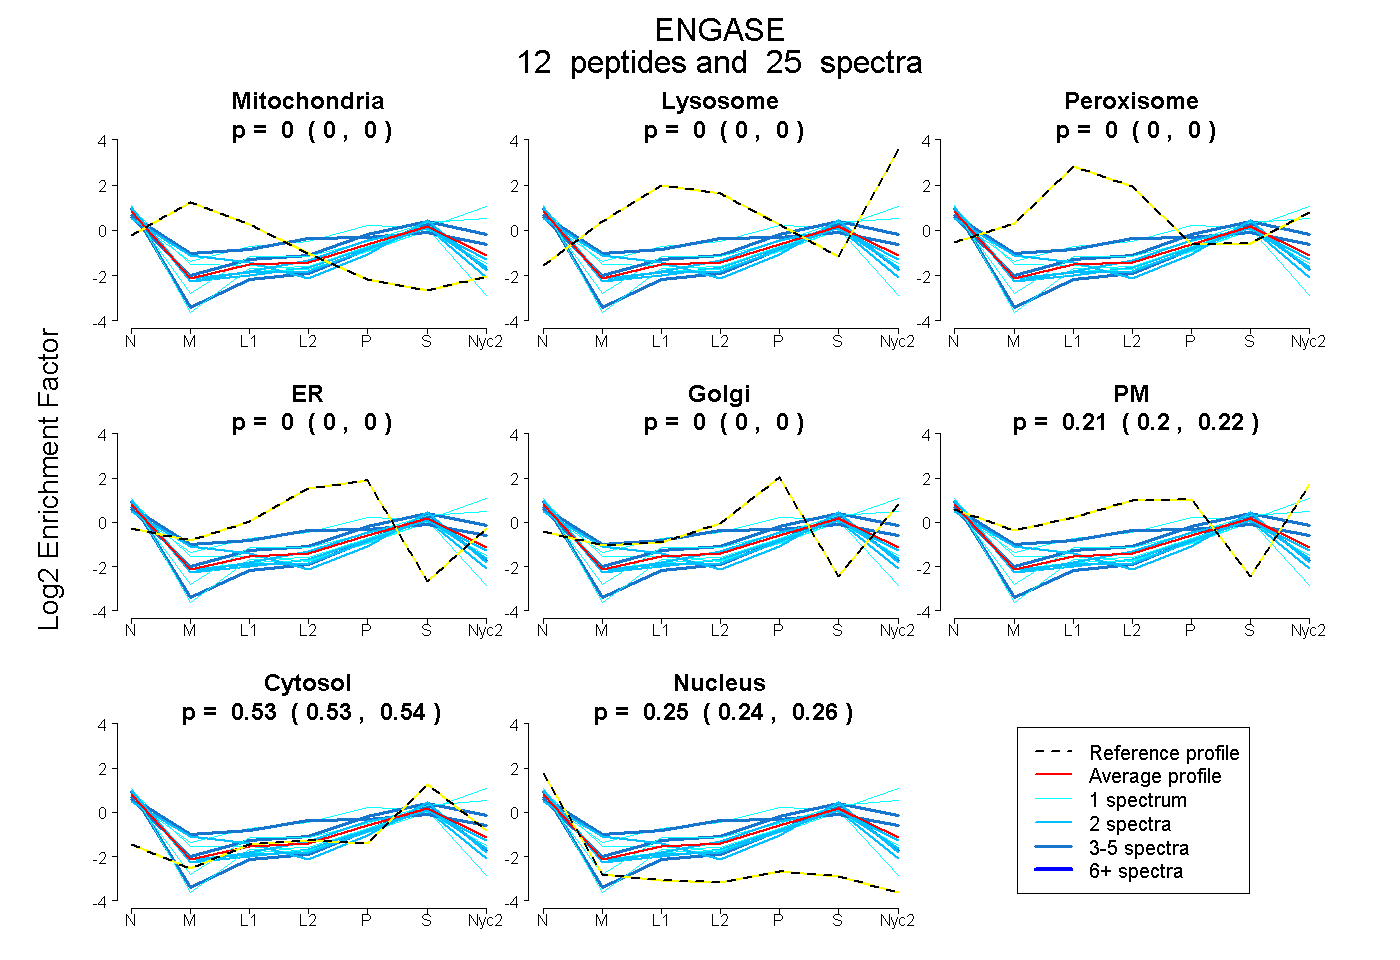
0.000 | 0.000
0.000 | 0.000
0.000 | 0.000
0.000 | 0.000
0.000 | 0.000
0.203 | 0.223
0.526 | 0.537
0.244 | 0.262
2peptides
spectra
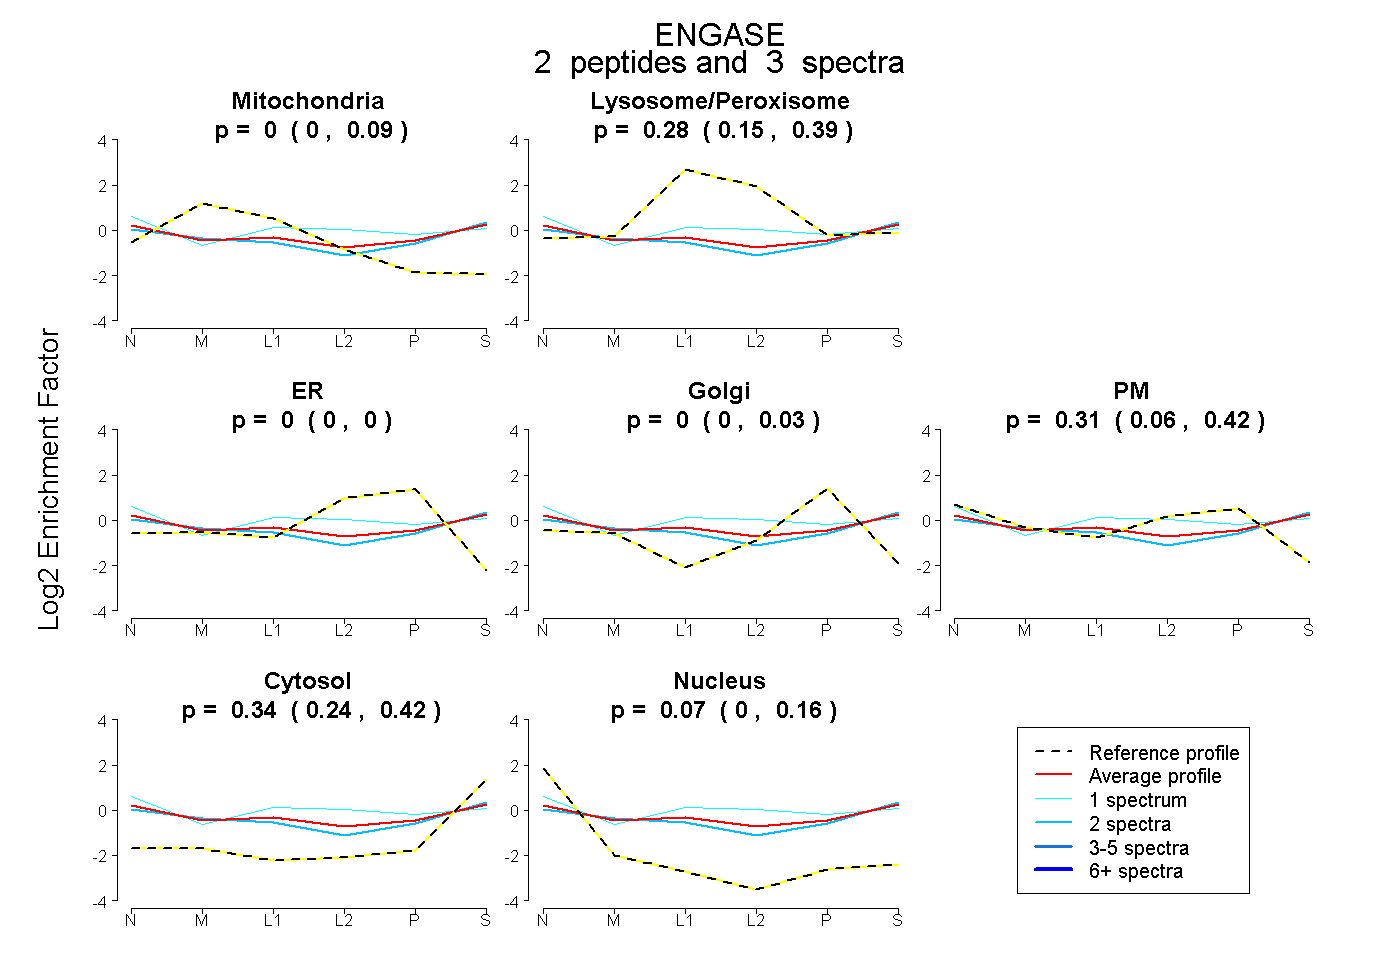
0.000 | 0.089
0.146 | 0.392
0.000 | 0.000
0.000 | 0.026
0.064 | 0.422
0.239 | 0.417
0.000 | 0.156
5peptides
spectra
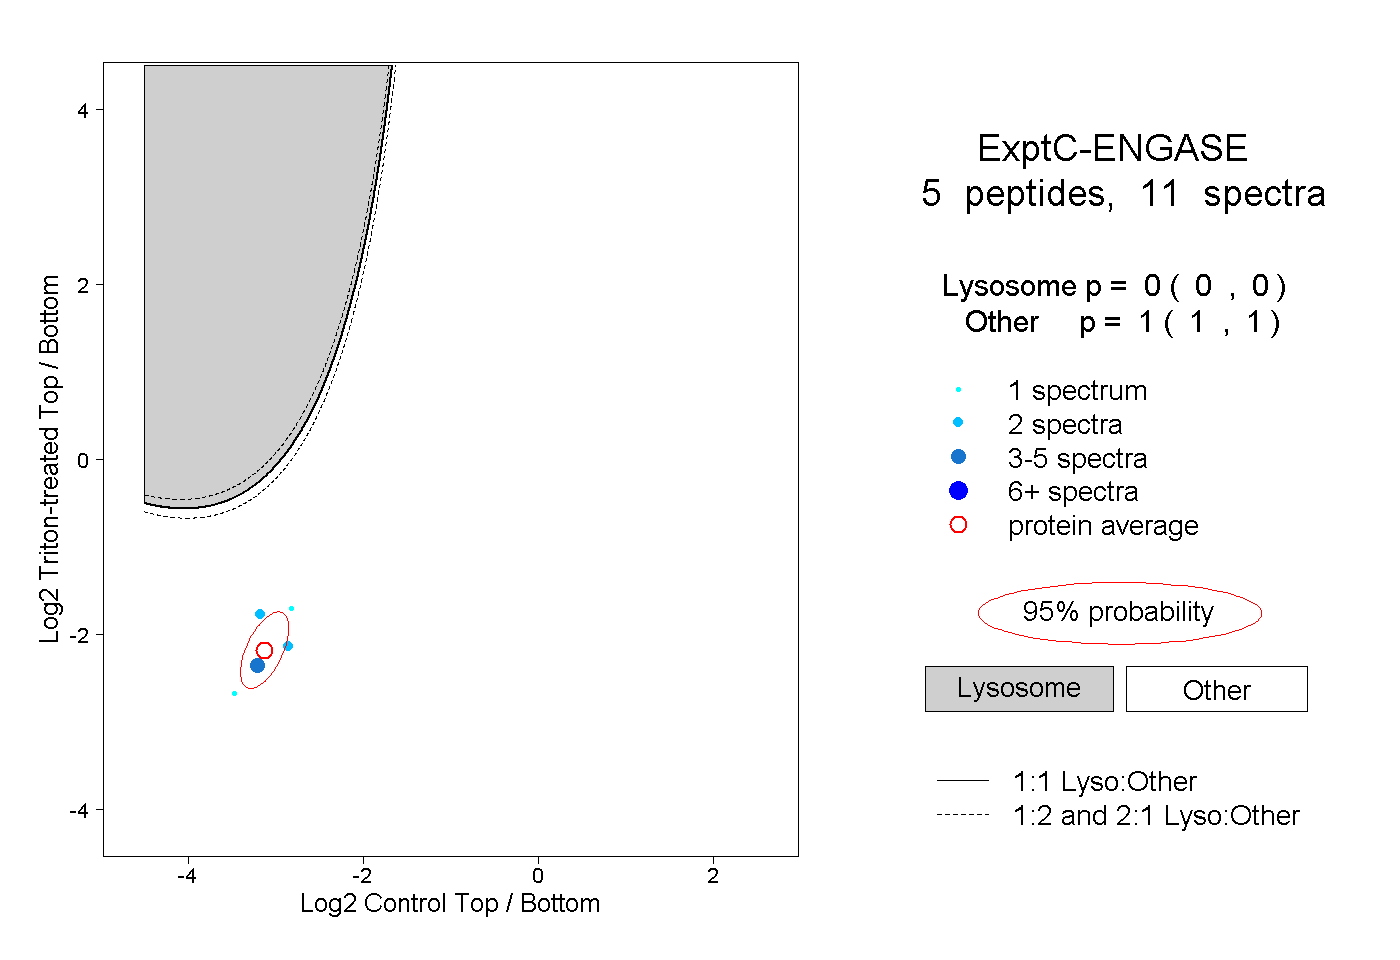
0.000 | 0.000
1.000 | 1.000
1peptide
spectrum
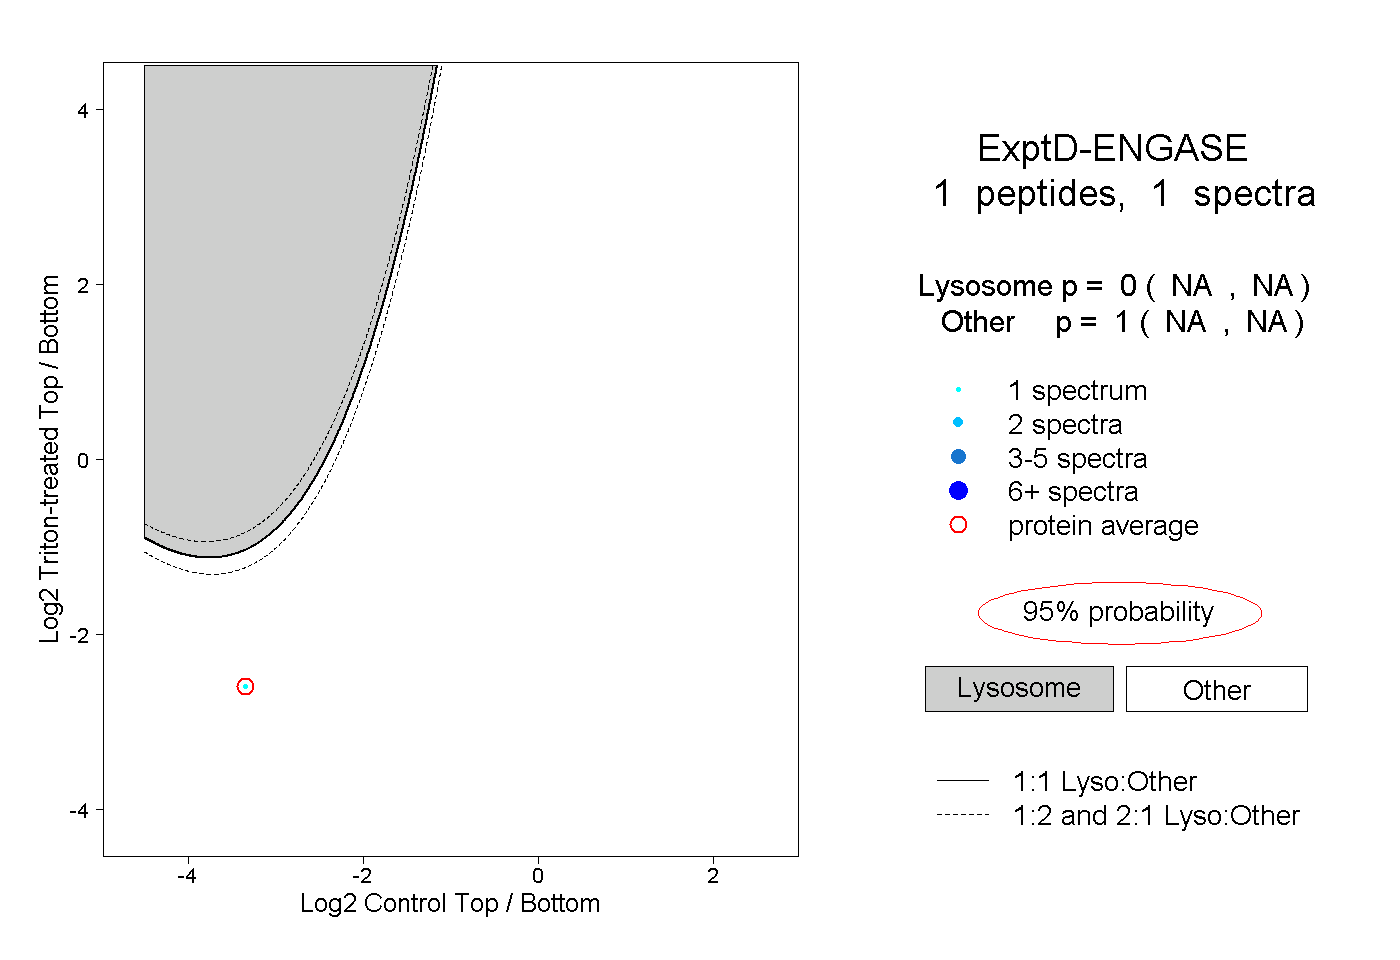
NA | NA
NA | NA