 12
12peptides
spectra
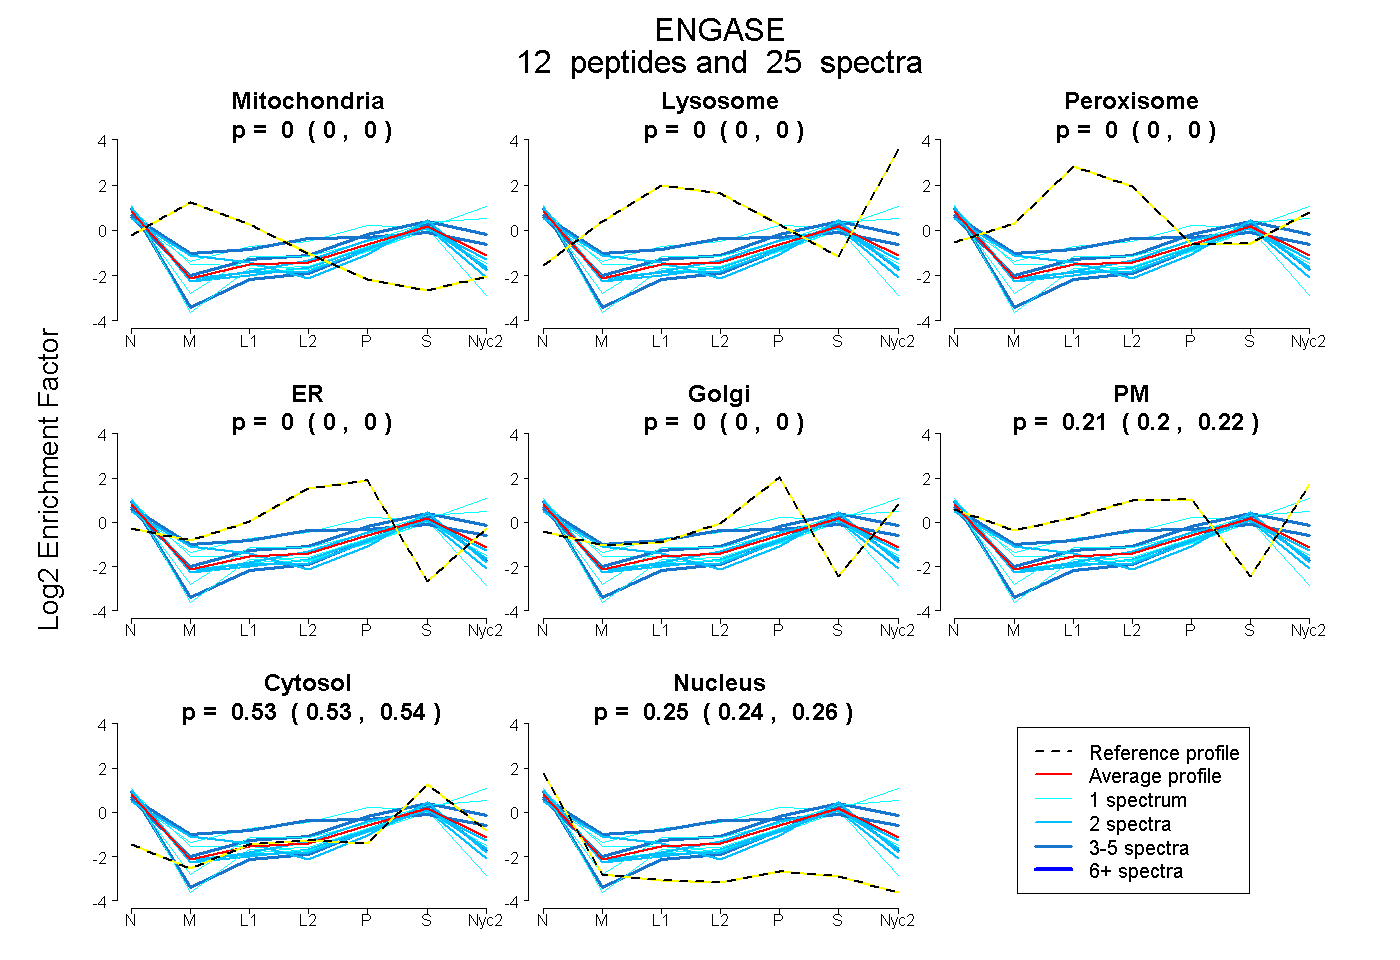
0.000 | 0.000
0.000 | 0.000
0.000 | 0.000
0.000 | 0.000
0.000 | 0.000
0.203 | 0.223
0.526 | 0.537
0.244 | 0.262
| Plot | Mito | Lyso | Perox | ER | Golgi | PM | Cytosol | Nucleus | |||||
| Expt A |
12 peptides |
25 spectra |
|
0.000 0.000 | 0.000 |
0.000 0.000 | 0.000 |
0.000 0.000 | 0.000 |
0.000 0.000 | 0.000 |
0.000 0.000 | 0.000 |
0.214 0.203 | 0.223 |
0.532 0.526 | 0.537 |
0.254 0.244 | 0.262 |
| 1 spectrum, SFQAVADR | 0.000 | 0.000 | 0.000 | 0.000 | 0.000 | 0.312 | 0.591 | 0.097 | ||
| 2 spectra, VVDLAVEAAR | 0.000 | 0.000 | 0.000 | 0.000 | 0.000 | 0.135 | 0.513 | 0.351 | ||
| 1 spectrum, GLIPPEVDSVAVR | 0.000 | 0.000 | 0.020 | 0.000 | 0.000 | 0.201 | 0.463 | 0.316 | ||
| 1 spectrum, QAQDQPER | 0.000 | 0.000 | 0.000 | 0.070 | 0.000 | 0.000 | 0.500 | 0.430 | ||
| 5 spectra, QPPLSSPRPR | 0.000 | 0.000 | 0.135 | 0.000 | 0.000 | 0.312 | 0.390 | 0.164 | ||
| 1 spectrum, FGQDGR | 0.000 | 0.000 | 0.000 | 0.000 | 0.000 | 0.525 | 0.475 | 0.000 | ||
| 2 spectra, LCEAFLAGDER | 0.000 | 0.000 | 0.000 | 0.105 | 0.000 | 0.018 | 0.506 | 0.371 | ||
| 3 spectra, MVAQAGER | 0.000 | 0.000 | 0.000 | 0.000 | 0.000 | 0.313 | 0.581 | 0.107 | ||
| 4 spectra, DQEEEAVFR | 0.000 | 0.000 | 0.000 | 0.000 | 0.052 | 0.000 | 0.585 | 0.362 | ||
| 1 spectrum, NTPLFLQYLTR | 0.000 | 0.000 | 0.000 | 0.000 | 0.000 | 0.161 | 0.487 | 0.351 | ||
| 2 spectra, VQNVTISQLR | 0.189 | 0.000 | 0.000 | 0.000 | 0.000 | 0.028 | 0.572 | 0.211 | ||
| 2 spectra, WQDELNEQNR | 0.000 | 0.000 | 0.000 | 0.000 | 0.066 | 0.159 | 0.497 | 0.278 |
| Plot | Mito | Lyso or Perox | ER | Golgi | PM | Cytosol | Nucleus | ||||||
| Expt B |
2 peptides |
3 spectra |
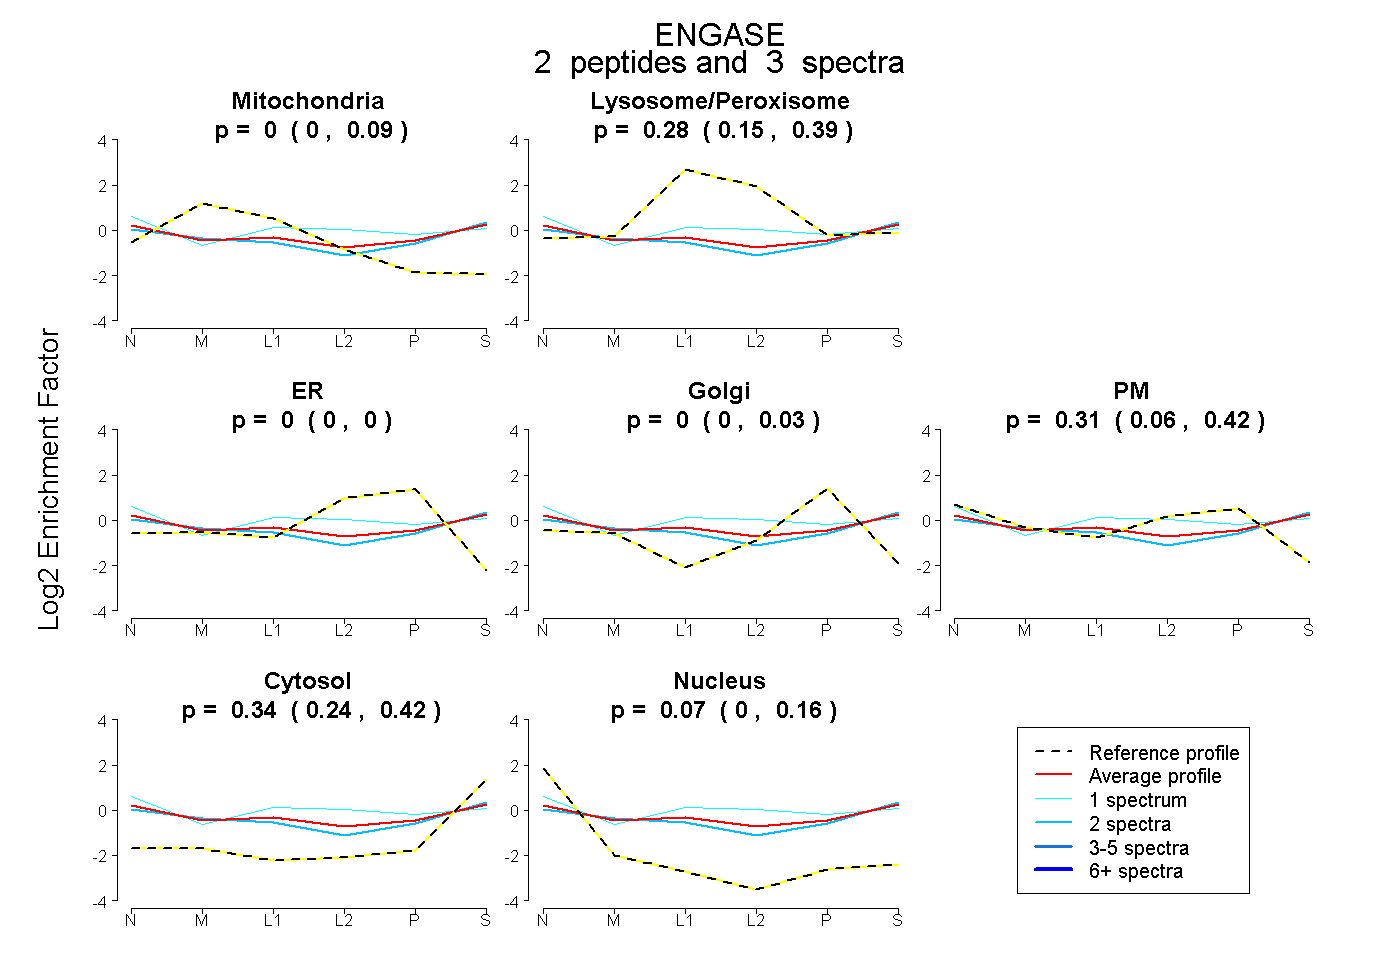 |
0.000 0.000 | 0.089 |
0.275 0.146 | 0.392 |
0.000 0.000 | 0.000 |
0.000 0.000 | 0.026 |
0.313 0.064 | 0.422 |
0.344 0.239 | 0.417 |
0.068 0.000 | 0.156 |
|||
| Plot | Lyso | Other | |||||||||||
| Expt C |
5 peptides |
11 spectra |
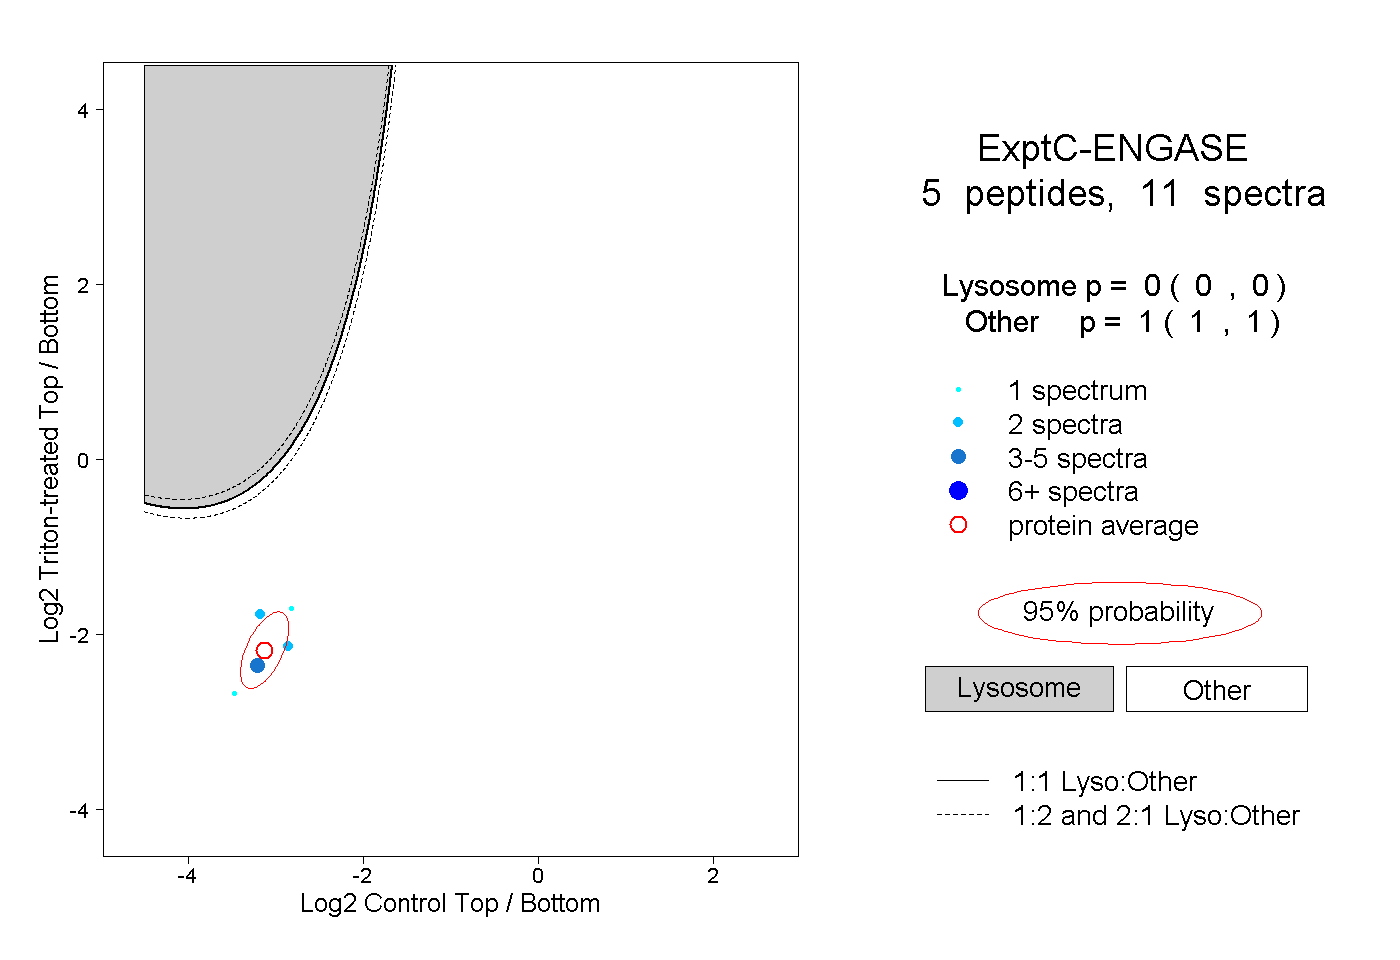 |
0.000 0.000 | 0.000 |
1.000 1.000 | 1.000 |
||||||||
| Plot | Lyso | Other | |||||||||||
| Expt D |
1 peptide |
1 spectrum |
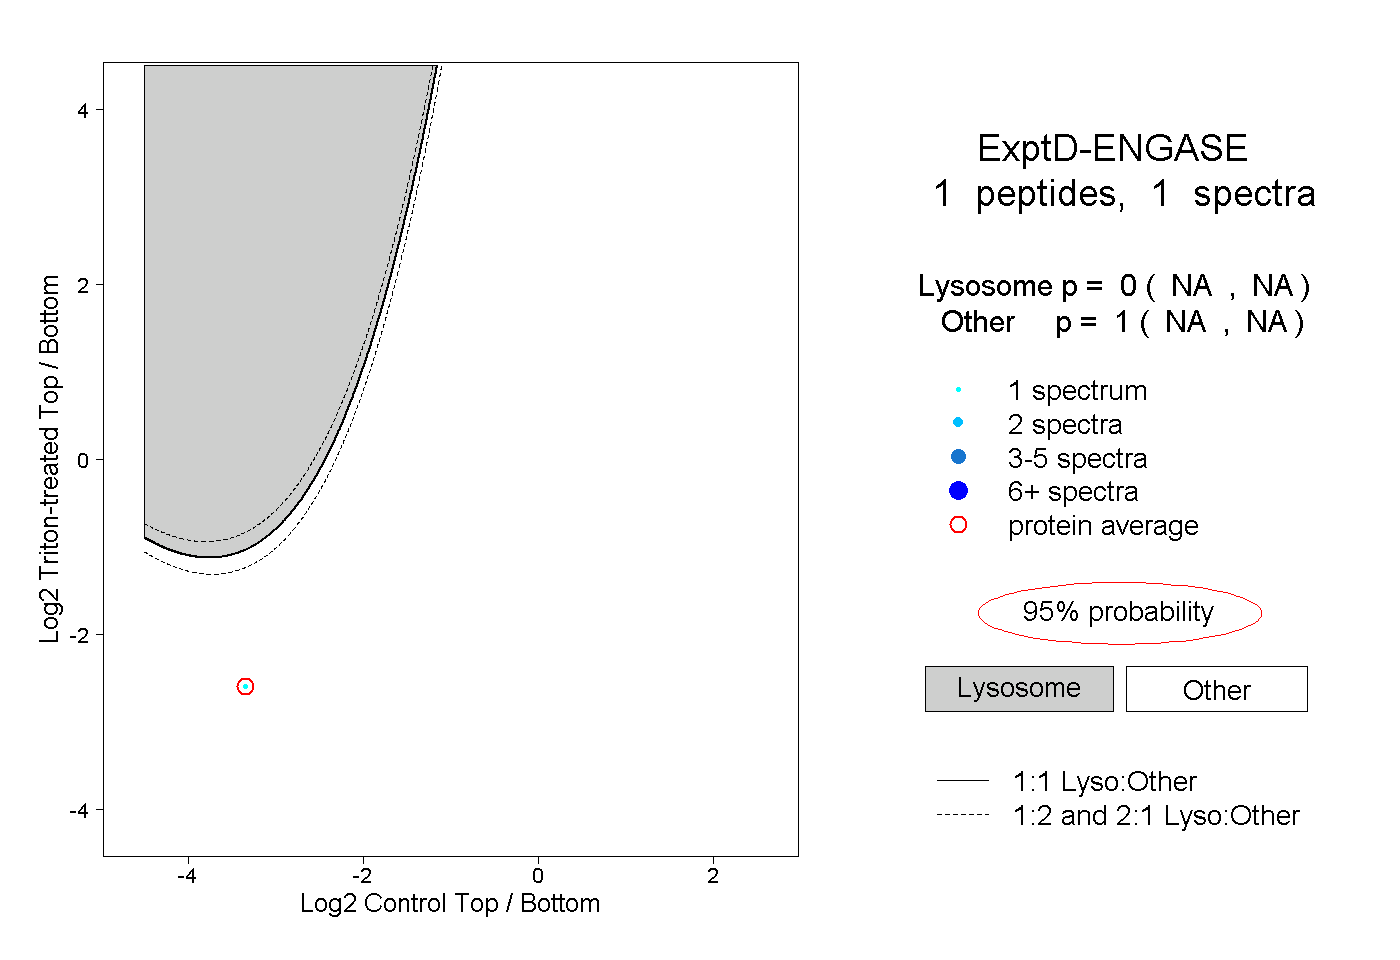 |
0.000 NA | NA |
1.000 NA | NA |