 8
8peptides
spectra

0.000 | 0.000
0.479 | 0.533
0.000 | 0.000
0.000 | 0.000
0.000 | 0.000
0.000 | 0.041
0.450 | 0.487
0.000 | 0.000
10peptides
spectra
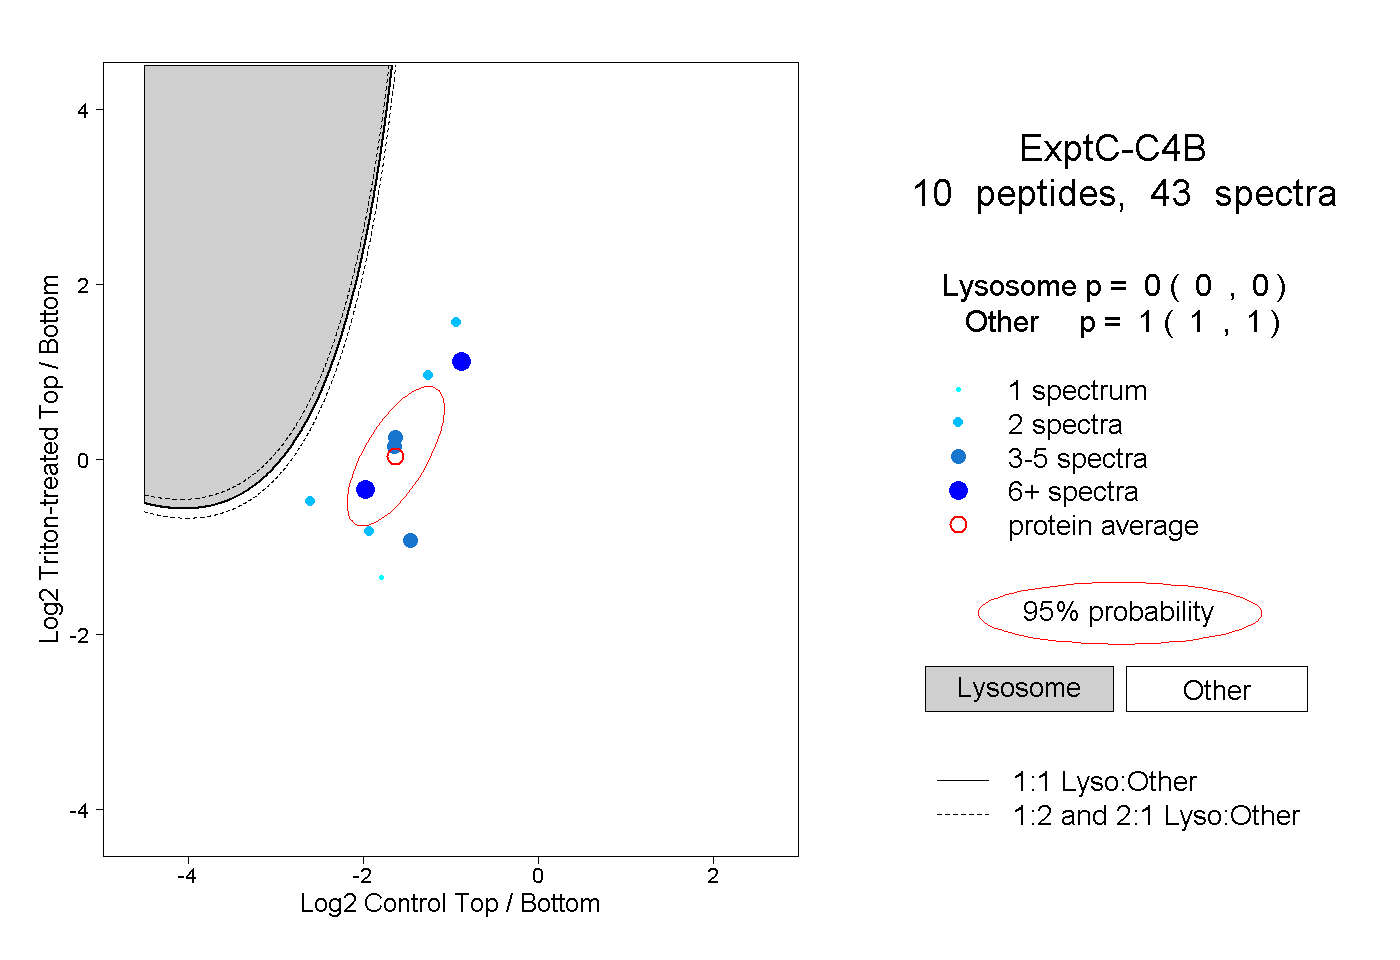
0.000 | 0.000
1.000 | 1.000
2peptides
spectra
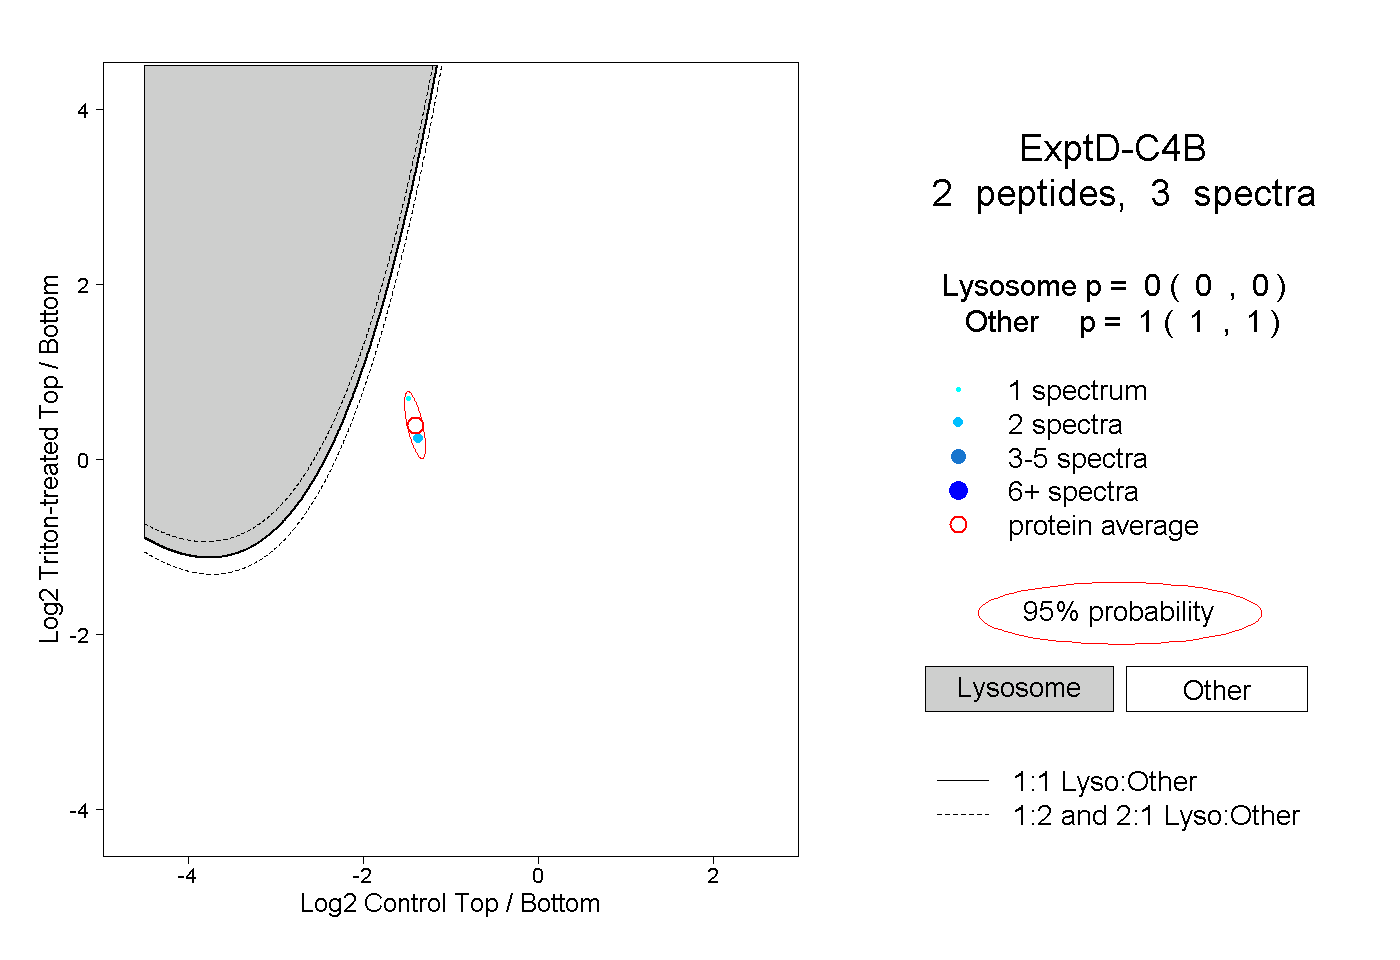
0.000 | 0.000
1.000 | 1.000