 8
8peptides
spectra

0.000 | 0.000
0.479 | 0.533
0.000 | 0.000
0.000 | 0.000
0.000 | 0.000
0.000 | 0.041
0.450 | 0.487
0.000 | 0.000
10peptides
spectra
0.000 | 0.000
1.000 | 1.000
| Plot | Mito | Lyso | Perox | ER | Golgi | PM | Cytosol | Nucleus | |||||
| Expt A |
8 peptides |
11 spectra |
|
0.000 0.000 | 0.000 |
0.510 0.479 | 0.533 |
0.000 0.000 | 0.000 |
0.000 0.000 | 0.000 |
0.000 0.000 | 0.000 |
0.020 0.000 | 0.041 |
0.470 0.450 | 0.487 |
0.000 0.000 | 0.000 |
||
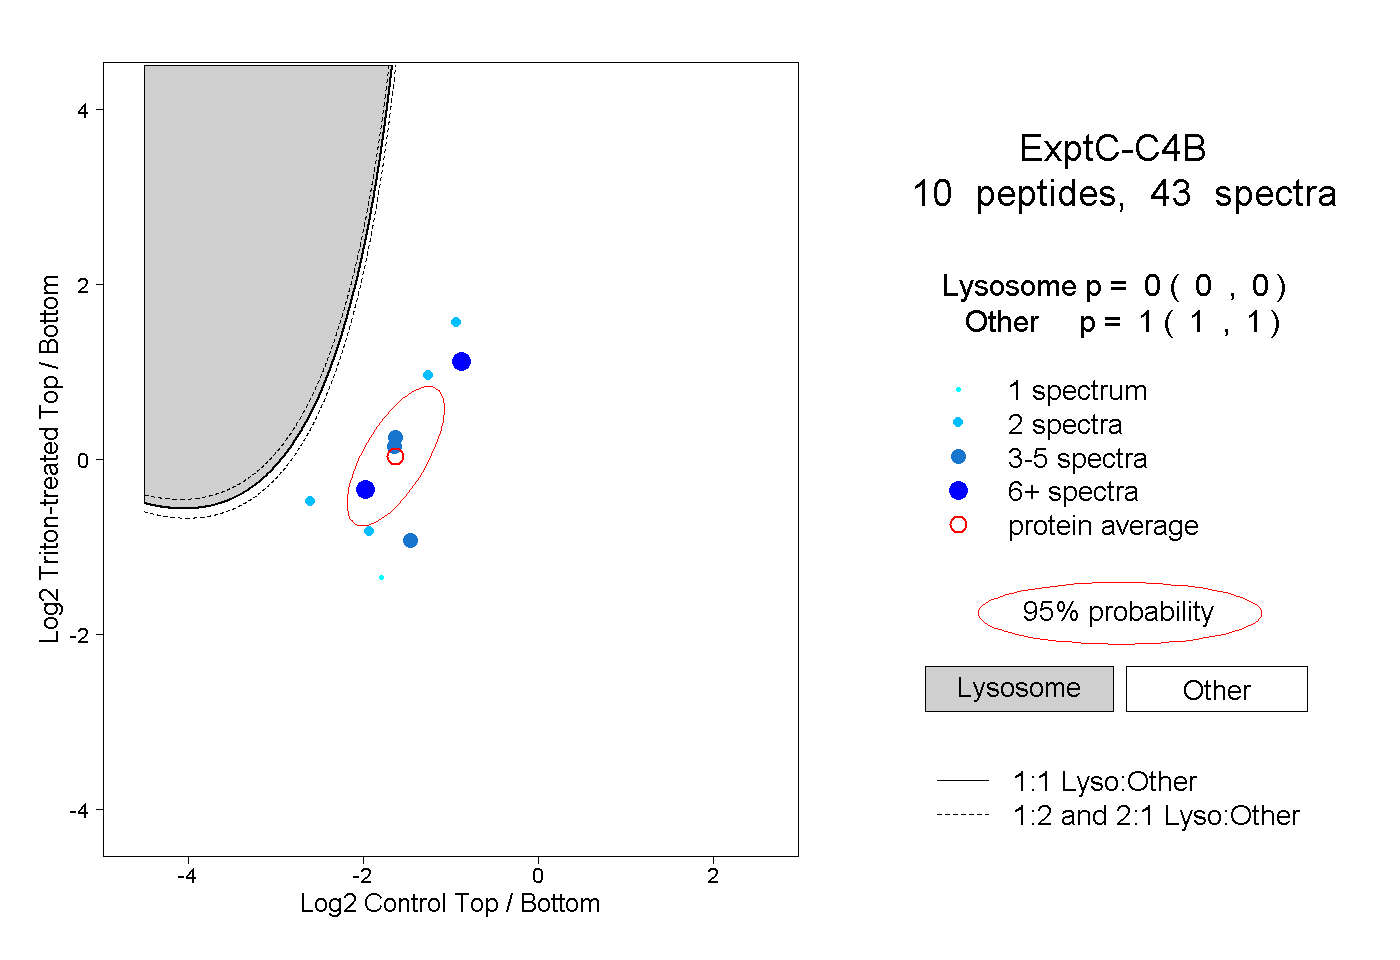
| Plot | Lyso | Other | |||||||||||
| Expt C |
10 peptides |
43 spectra |
|
0.000 0.000 | 0.000 |
1.000 1.000 | 1.000 |
| 1 spectrum, TYNVLDMK | 0.000 | 1.000 | ||||||||
| 2 spectra, VQYTVCIWR | 0.000 | 1.000 | ||||||||
| 7 spectra, LEVPLEDVR | 0.000 | 1.000 | ||||||||
| 15 spectra, LTSLSDR | 0.000 | 1.000 | ||||||||
| 4 spectra, GSFDIGDAVSK | 0.000 | 1.000 | ||||||||
| 2 spectra, APHIQLVAYSPWLK | 0.000 | 1.000 | ||||||||
| 2 spectra, SFFPENWLWK | 0.000 | 1.000 | ||||||||
| 2 spectra, VGDTFILNLR | 0.000 | 1.000 | ||||||||
| 4 spectra, CSVFYAGPTK | 0.000 | 1.000 | ||||||||
| 4 spectra, NCGLFDLR | 0.000 | 1.000 |
| Plot | Lyso | Other | |||||||||||
| Expt D |
2 peptides |
3 spectra |
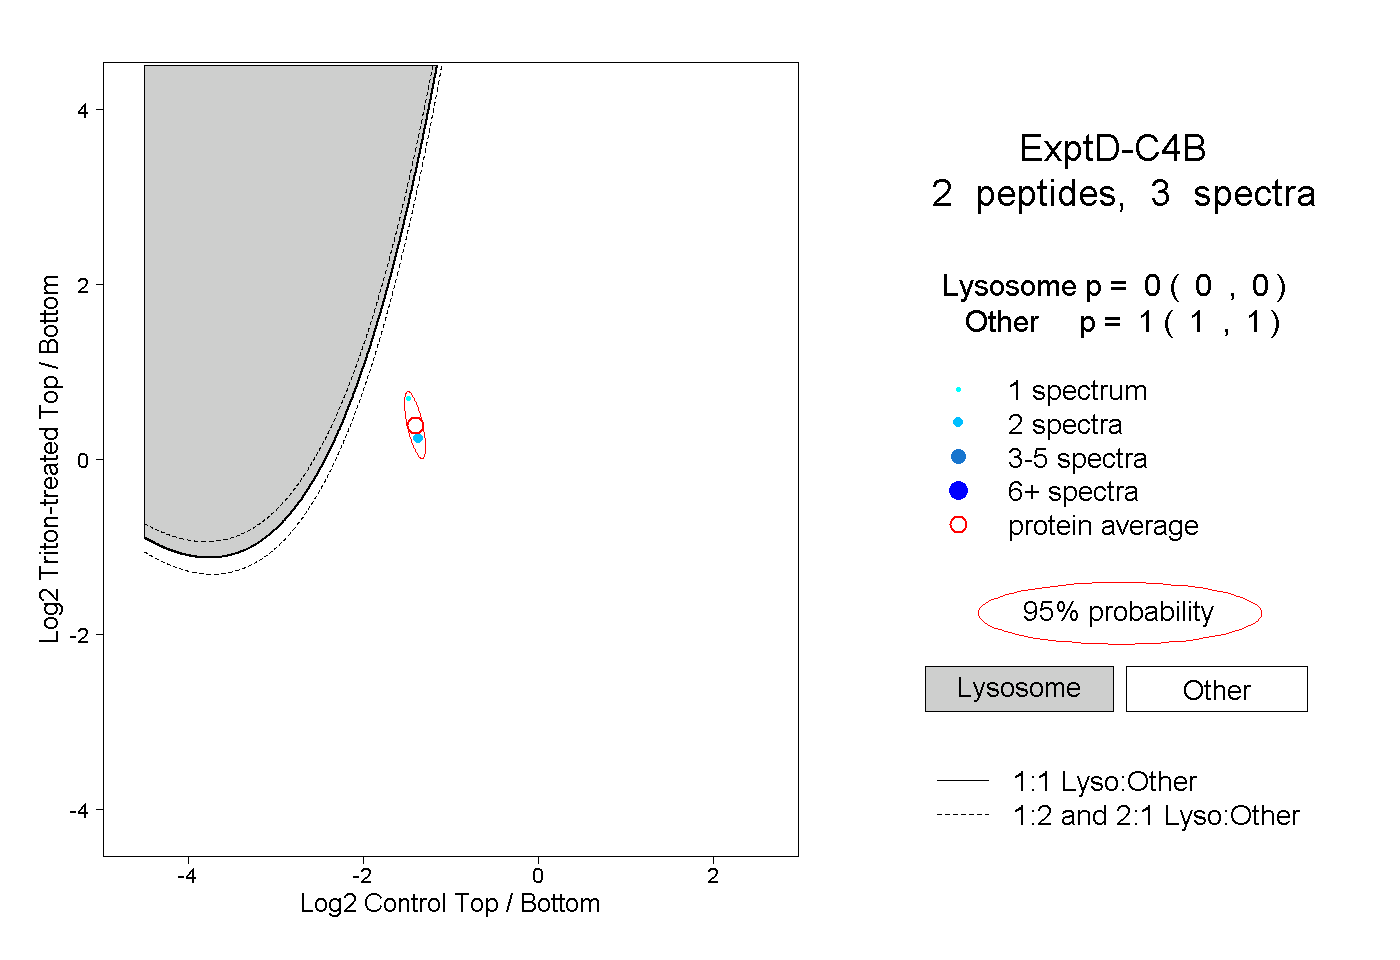 |
0.000 0.000 | 0.000 |
1.000 1.000 | 1.000 |