 1
1peptide
spectra
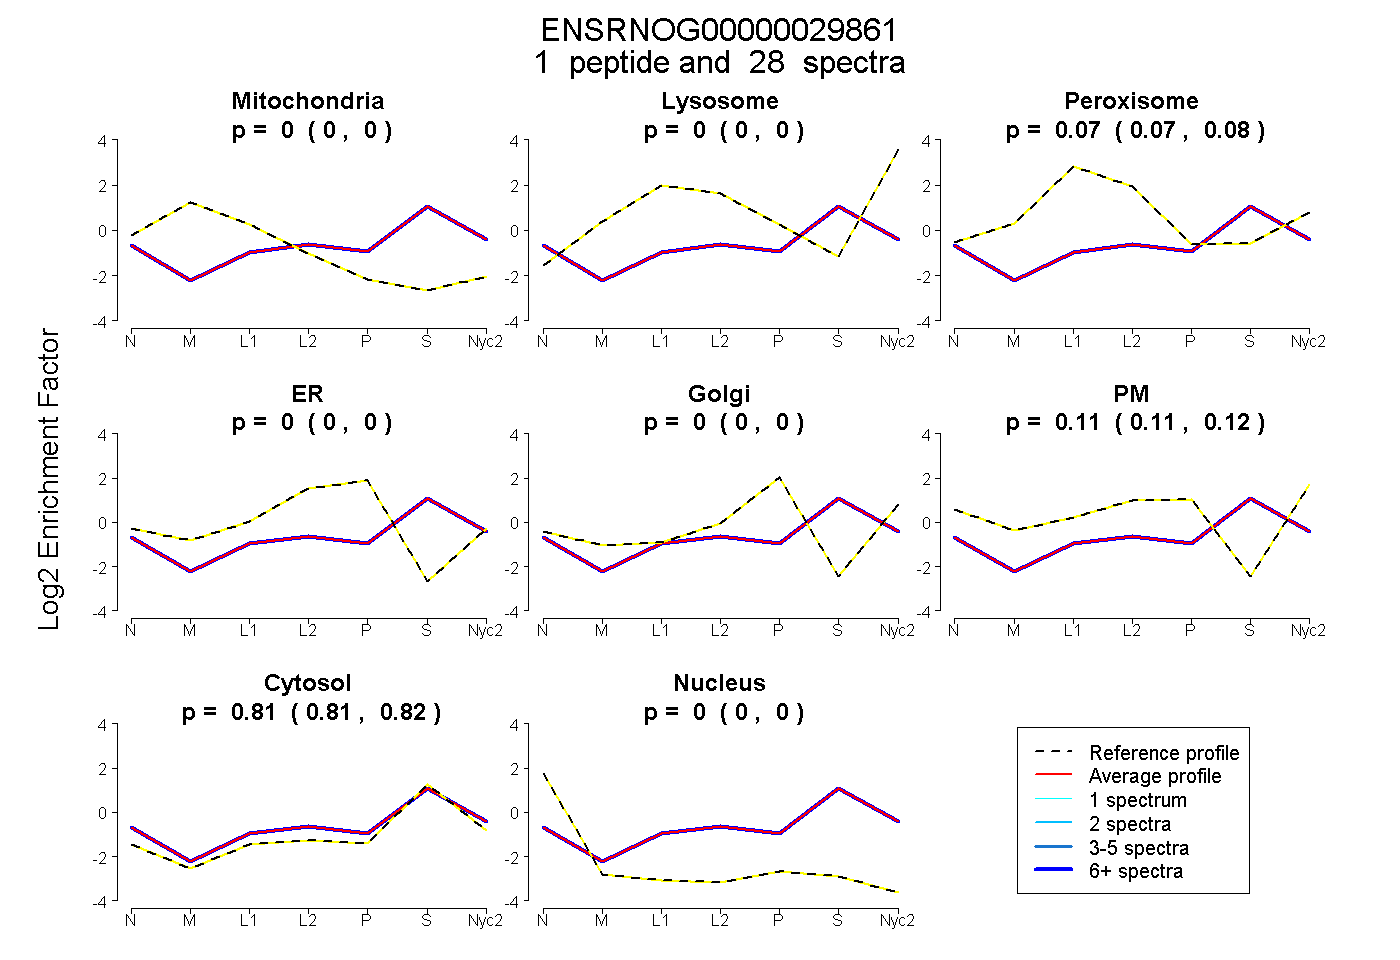
0.000 | 0.000
0.000 | 0.000
0.067 | 0.079
0.000 | 0.000
0.000 | 0.000
0.107 | 0.116
0.810 | 0.819
0.000 | 0.000
1peptide
spectra
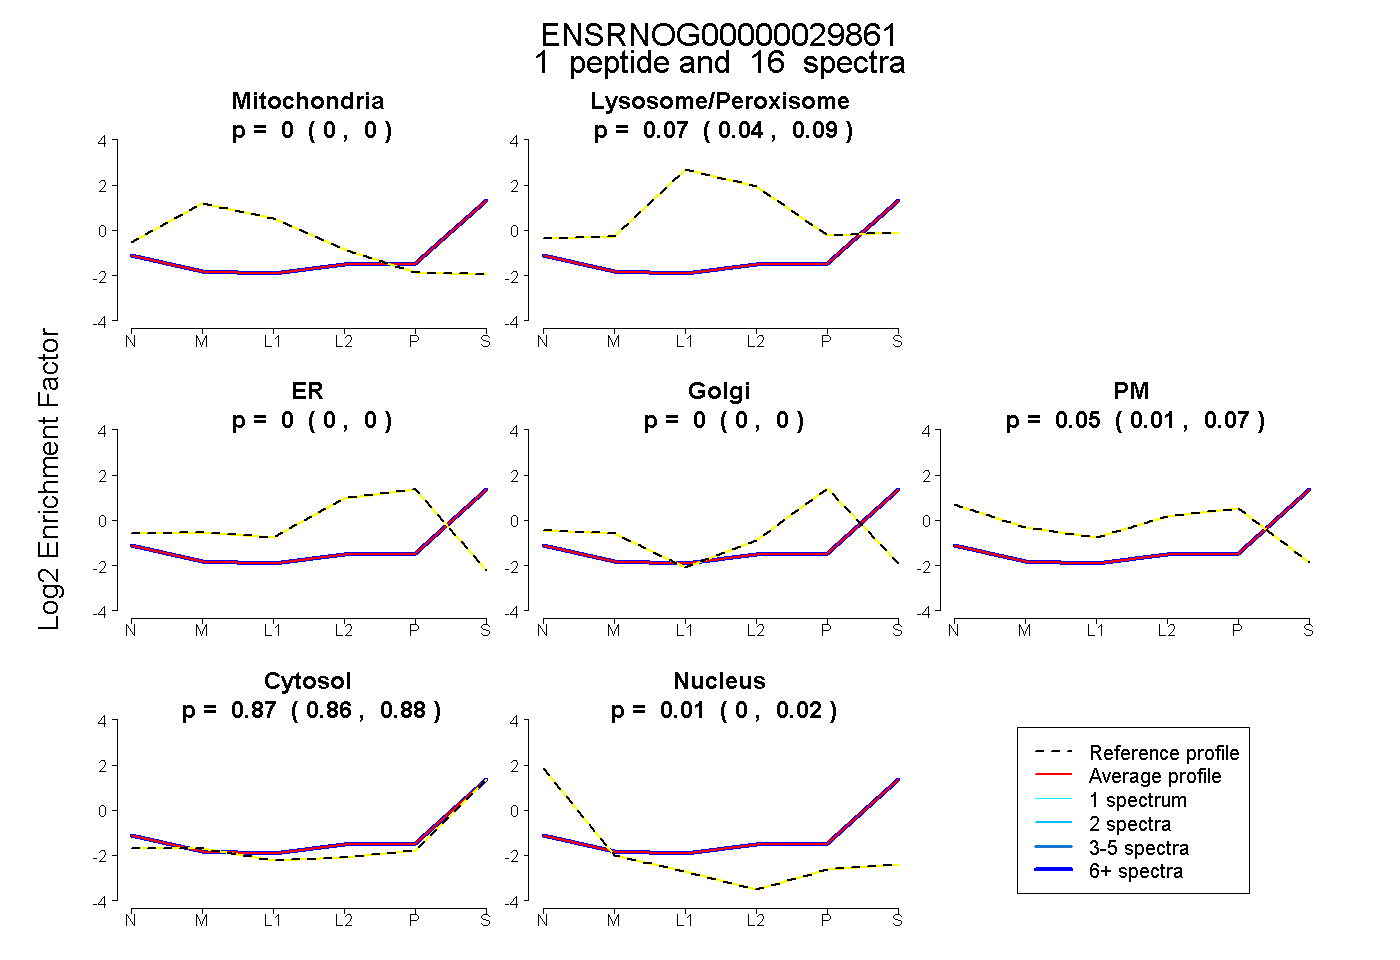
0.000 | 0.000
0.044 | 0.092
0.000 | 0.000
0.000 | 0.000
0.015 | 0.073
0.860 | 0.884
0.000 | 0.024
1peptide
spectra
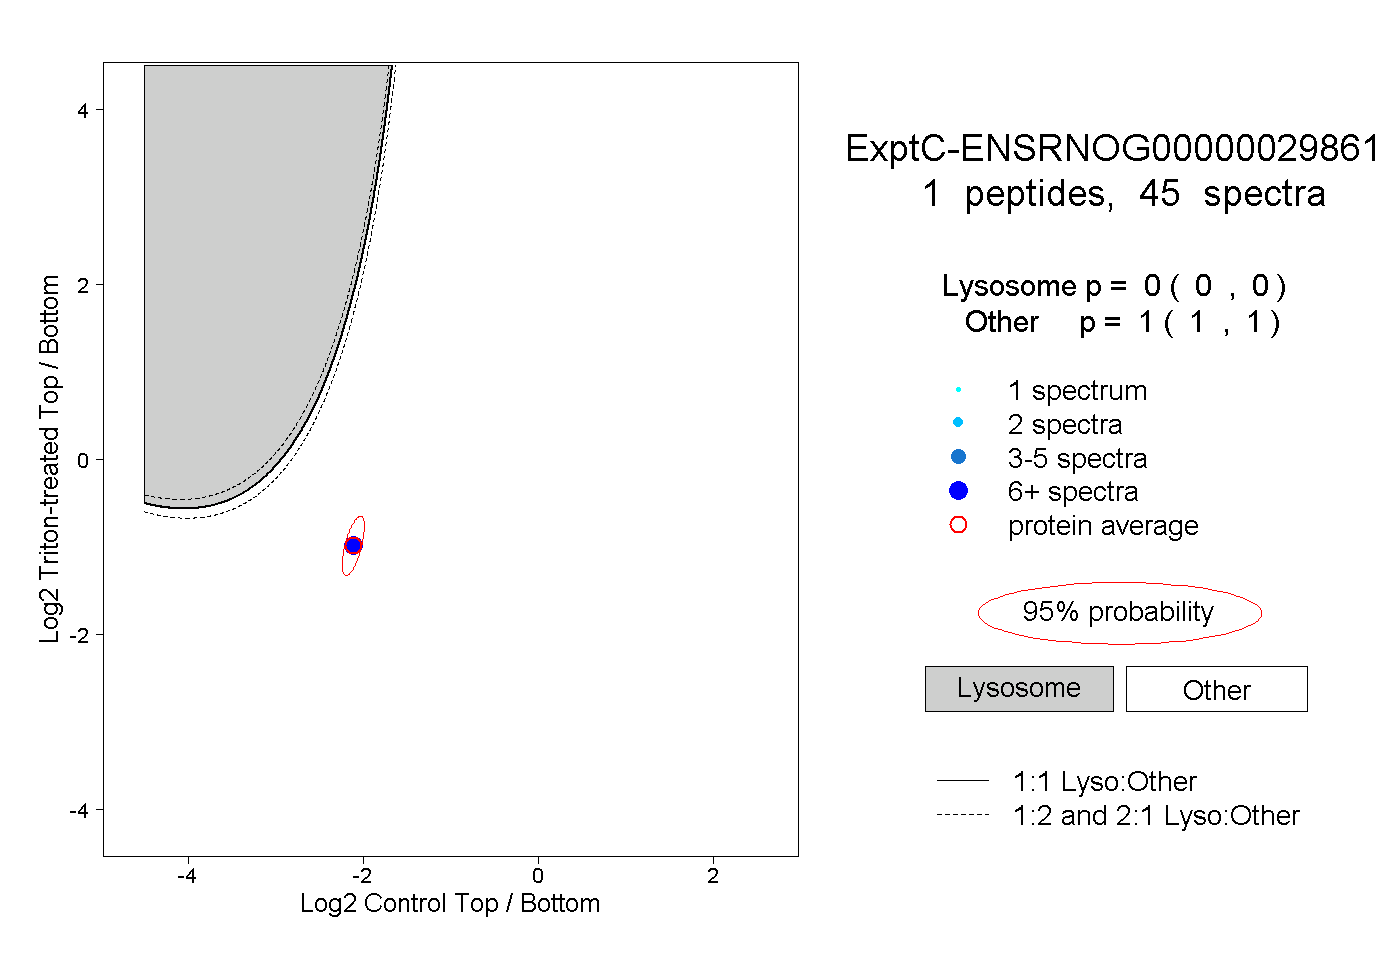
0.000 | 0.000
1.000 | 1.000
1peptide
spectrum
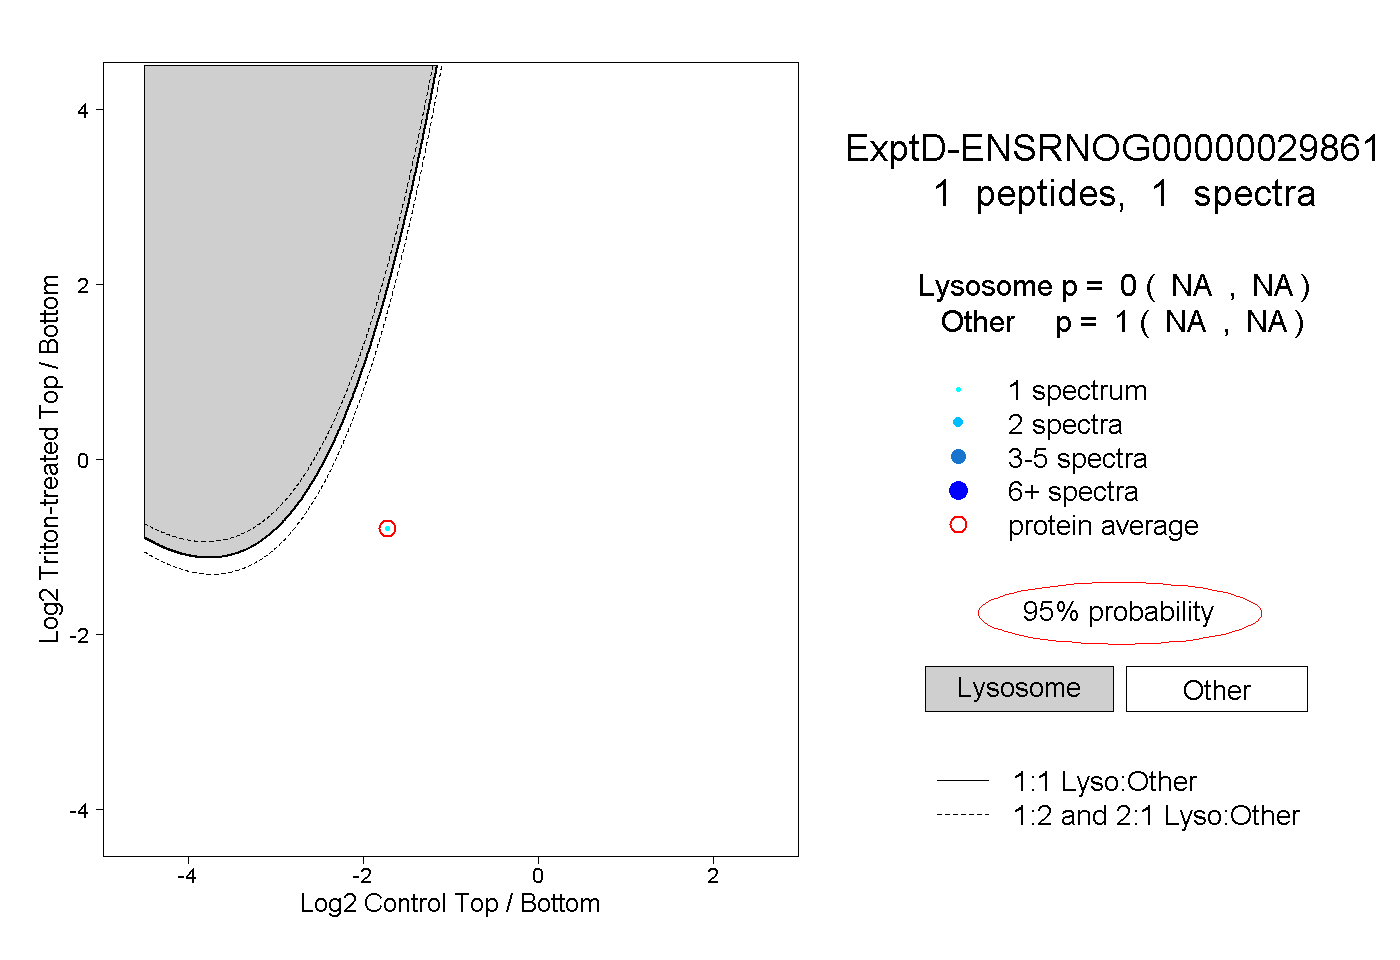
NA | NA
NA | NA