 1
1peptide
spectra
0.000 | 0.000
0.000 | 0.000
0.067 | 0.079
0.000 | 0.000
0.000 | 0.000
0.107 | 0.116
0.810 | 0.819
0.000 | 0.000
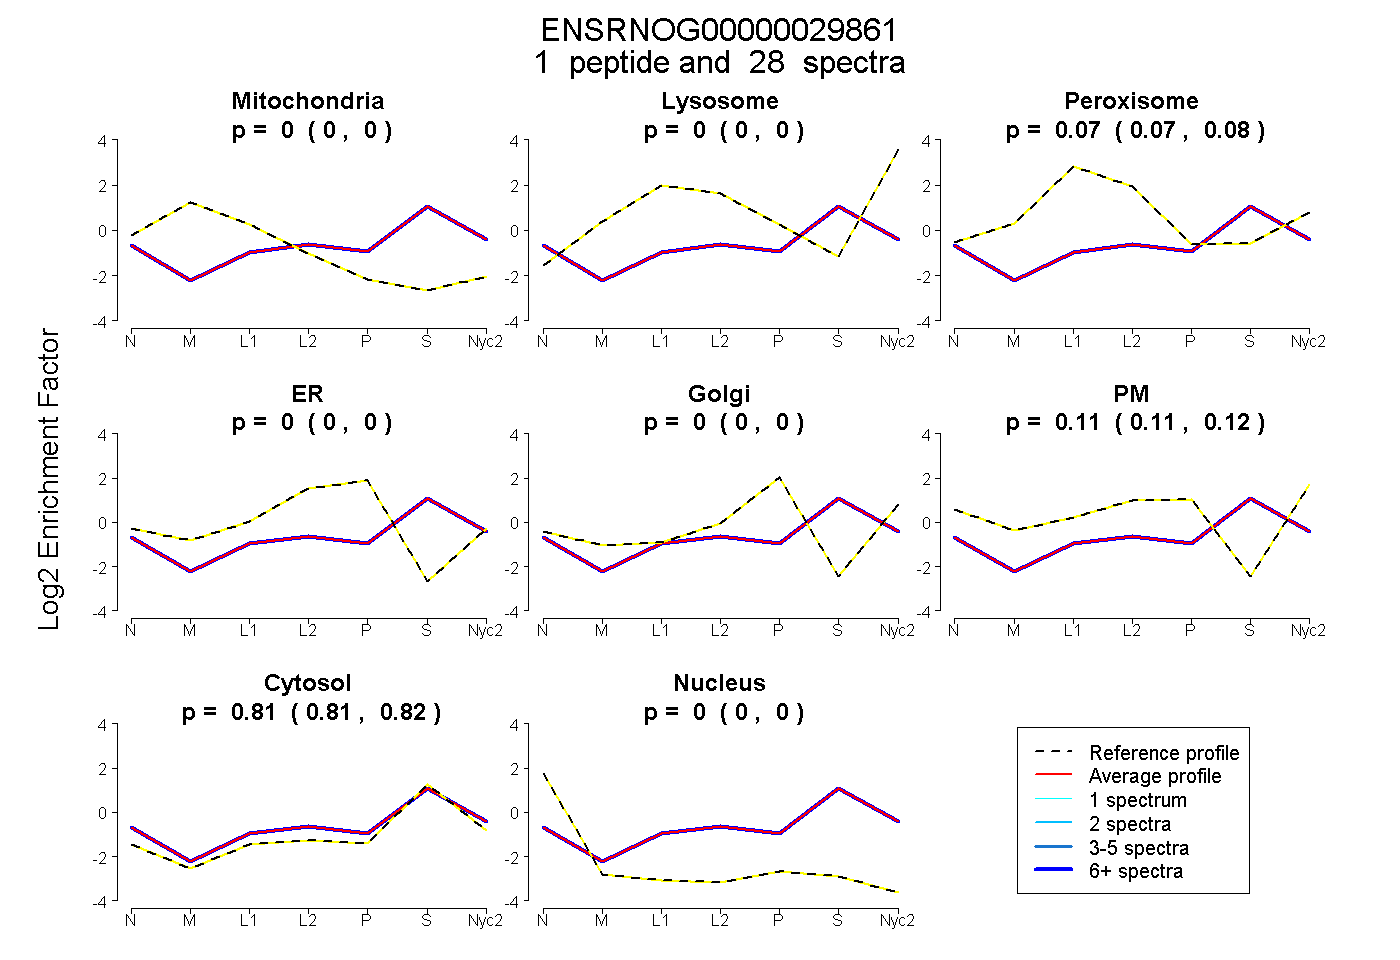
| Plot | Mito | Lyso | Perox | ER | Golgi | PM | Cytosol | Nucleus | |||||
| Expt A |
1 peptide |
28 spectra |
|
0.000 0.000 | 0.000 |
0.000 0.000 | 0.000 |
0.073 0.067 | 0.079 |
0.000 0.000 | 0.000 |
0.000 0.000 | 0.000 |
0.112 0.107 | 0.116 |
0.815 0.810 | 0.819 |
0.000 0.000 | 0.000 |
| 28 spectra, FIQSPEDLEK | 0.000 | 0.000 | 0.073 | 0.000 | 0.000 | 0.112 | 0.815 | 0.000 |
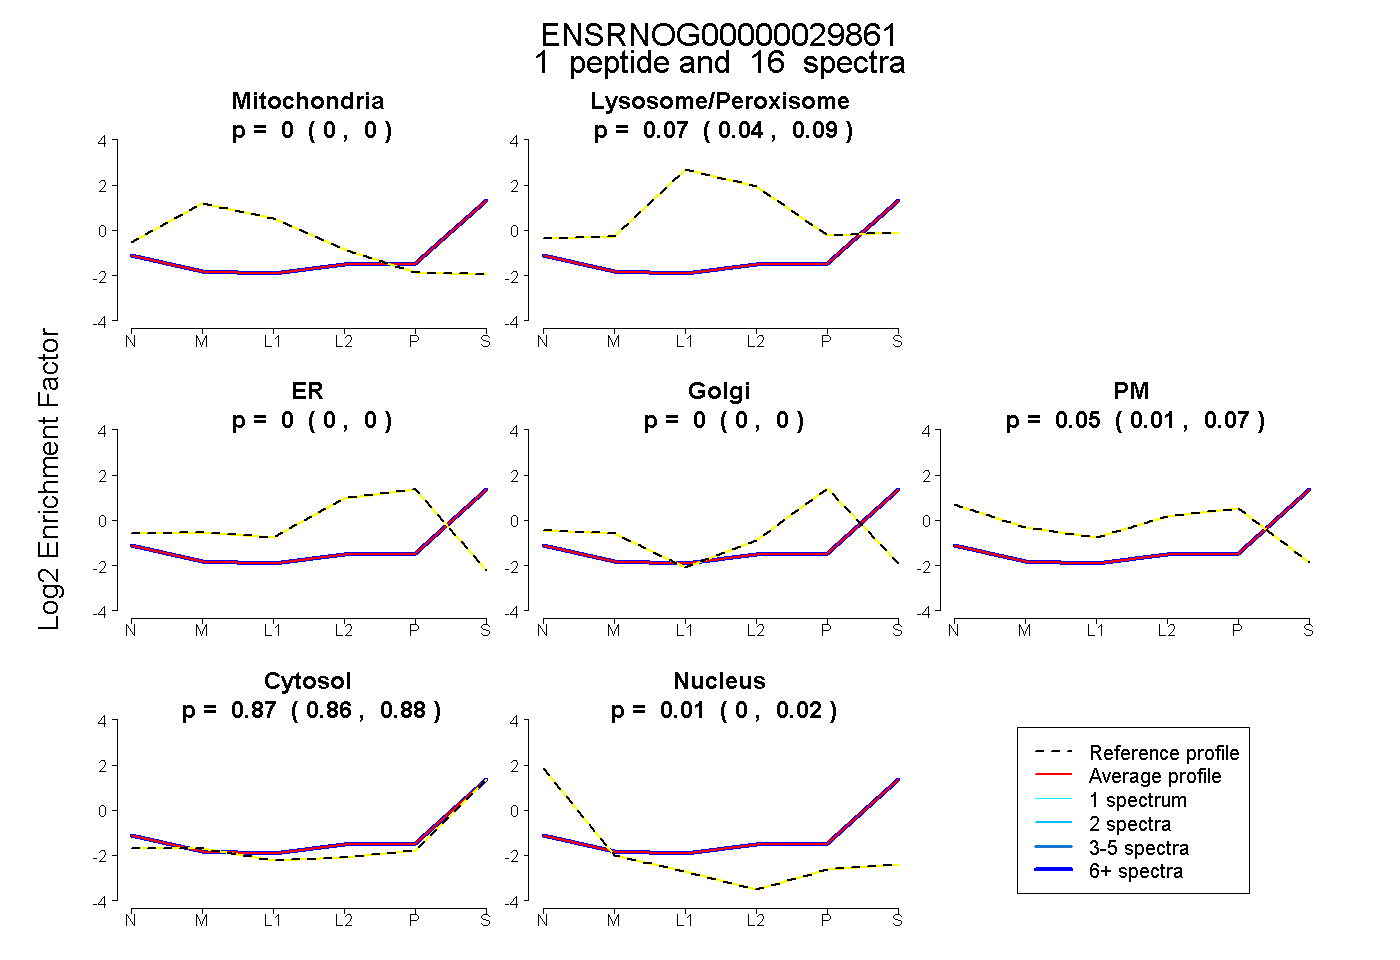
| Plot | Mito | Lyso or Perox | ER | Golgi | PM | Cytosol | Nucleus | ||||||
| Expt B |
1 peptide |
16 spectra |
 |
0.000 0.000 | 0.000 |
0.068 0.044 | 0.092 |
0.000 0.000 | 0.000 |
0.000 0.000 | 0.000 |
0.050 0.015 | 0.073 |
0.874 0.860 | 0.884 |
0.008 0.000 | 0.024 |
|||
| Plot | Lyso | Other | |||||||||||
| Expt C |
1 peptide |
45 spectra |
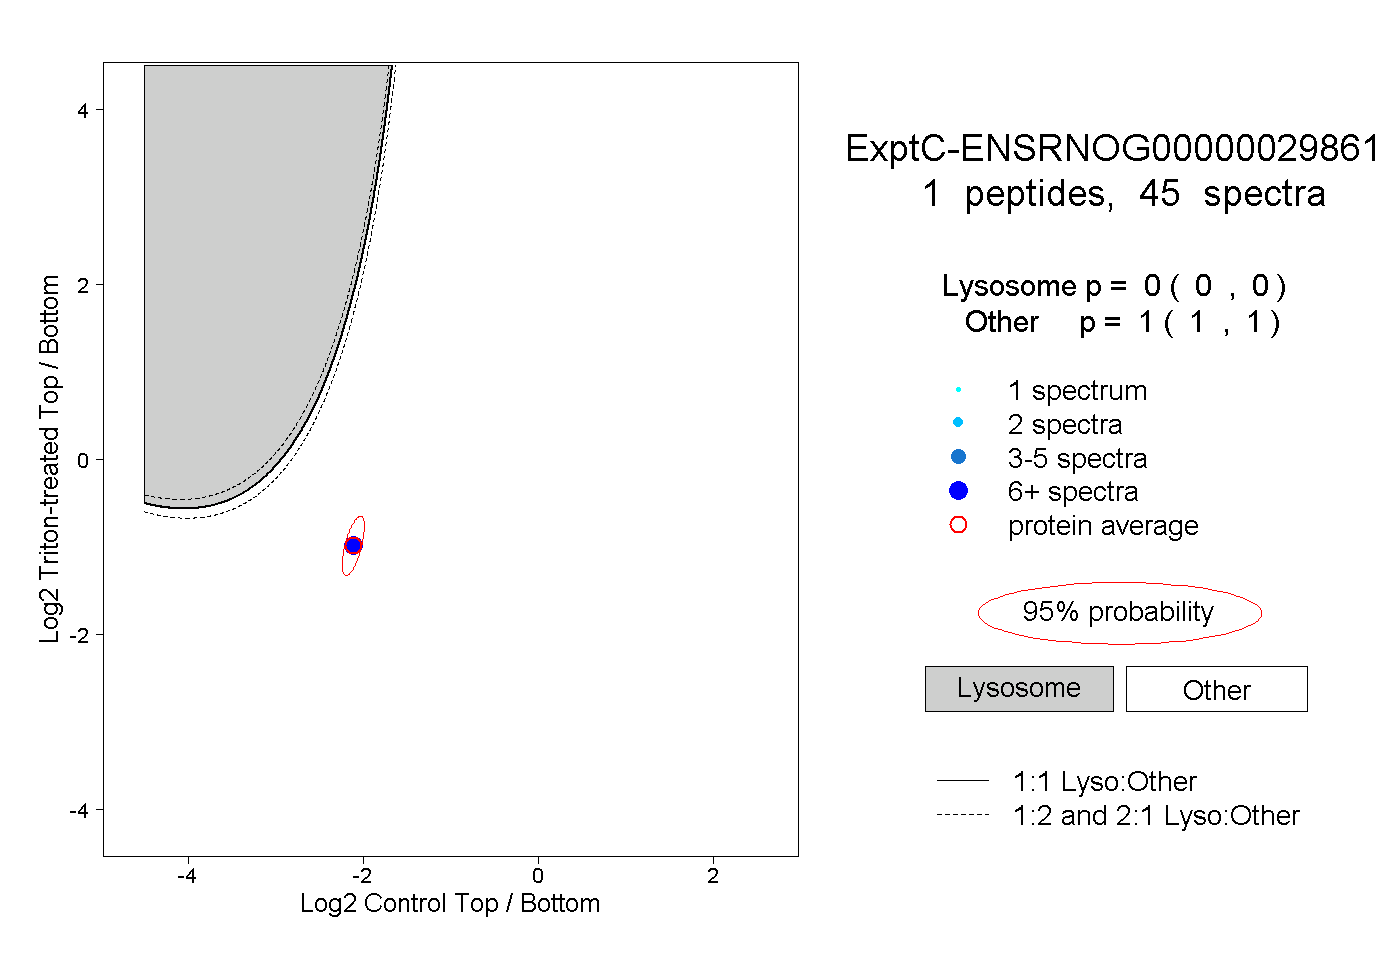 |
0.000 0.000 | 0.000 |
1.000 1.000 | 1.000 |
||||||||
| Plot | Lyso | Other | |||||||||||
| Expt D |
1 peptide |
1 spectrum |
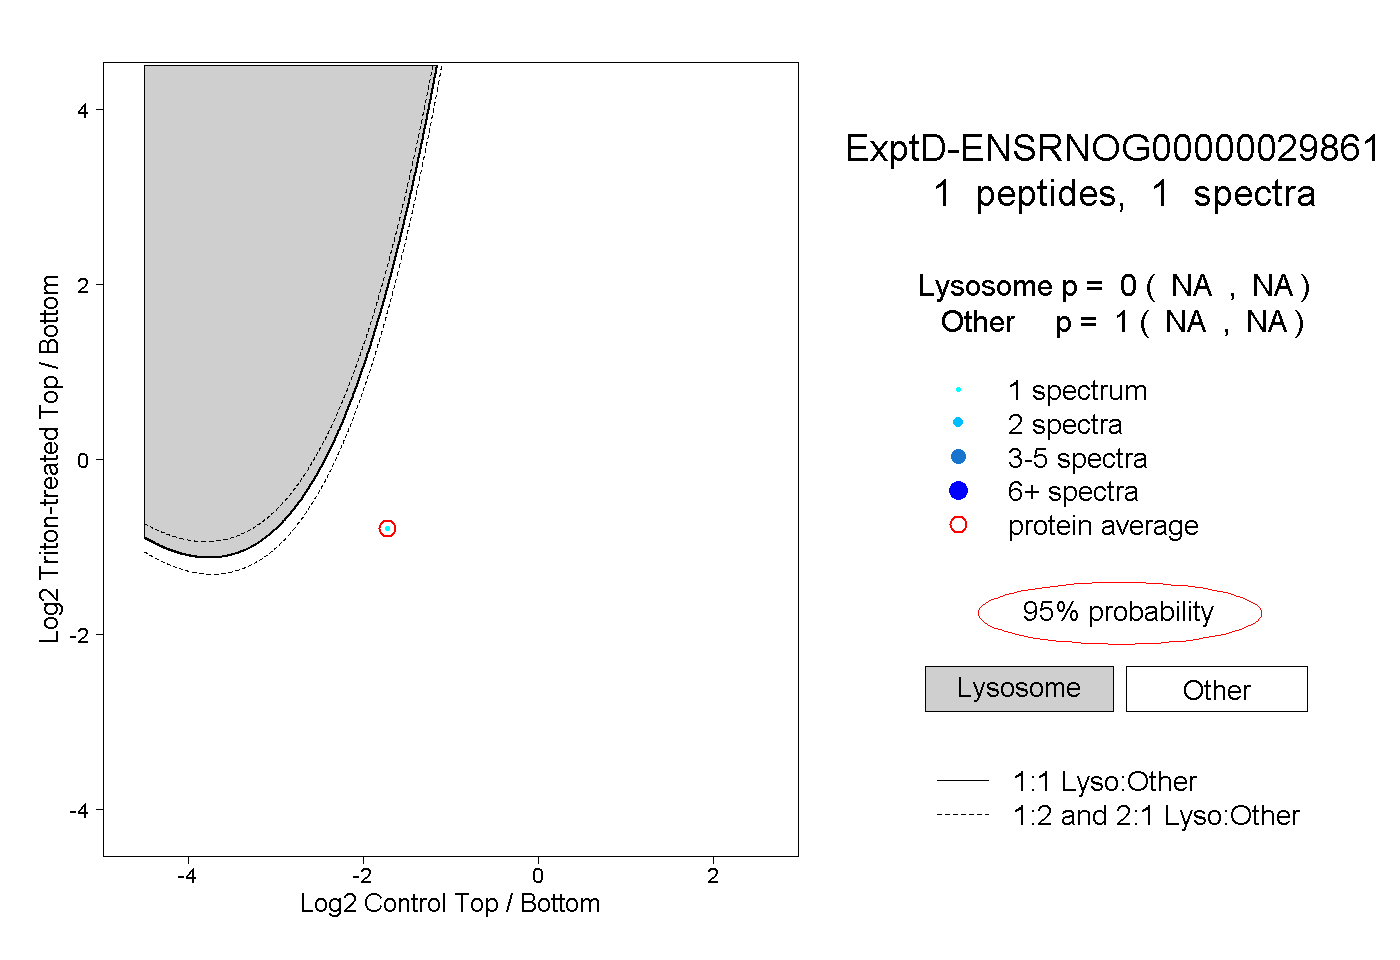 |
0.000 NA | NA |
1.000 NA | NA |