 13
13peptides
spectra

0.000 | 0.000
0.000 | 0.000
0.000 | 0.000
0.092 | 0.129
0.594 | 0.638
0.000 | 0.000
0.224 | 0.246
0.026 | 0.040
1peptide
spectra
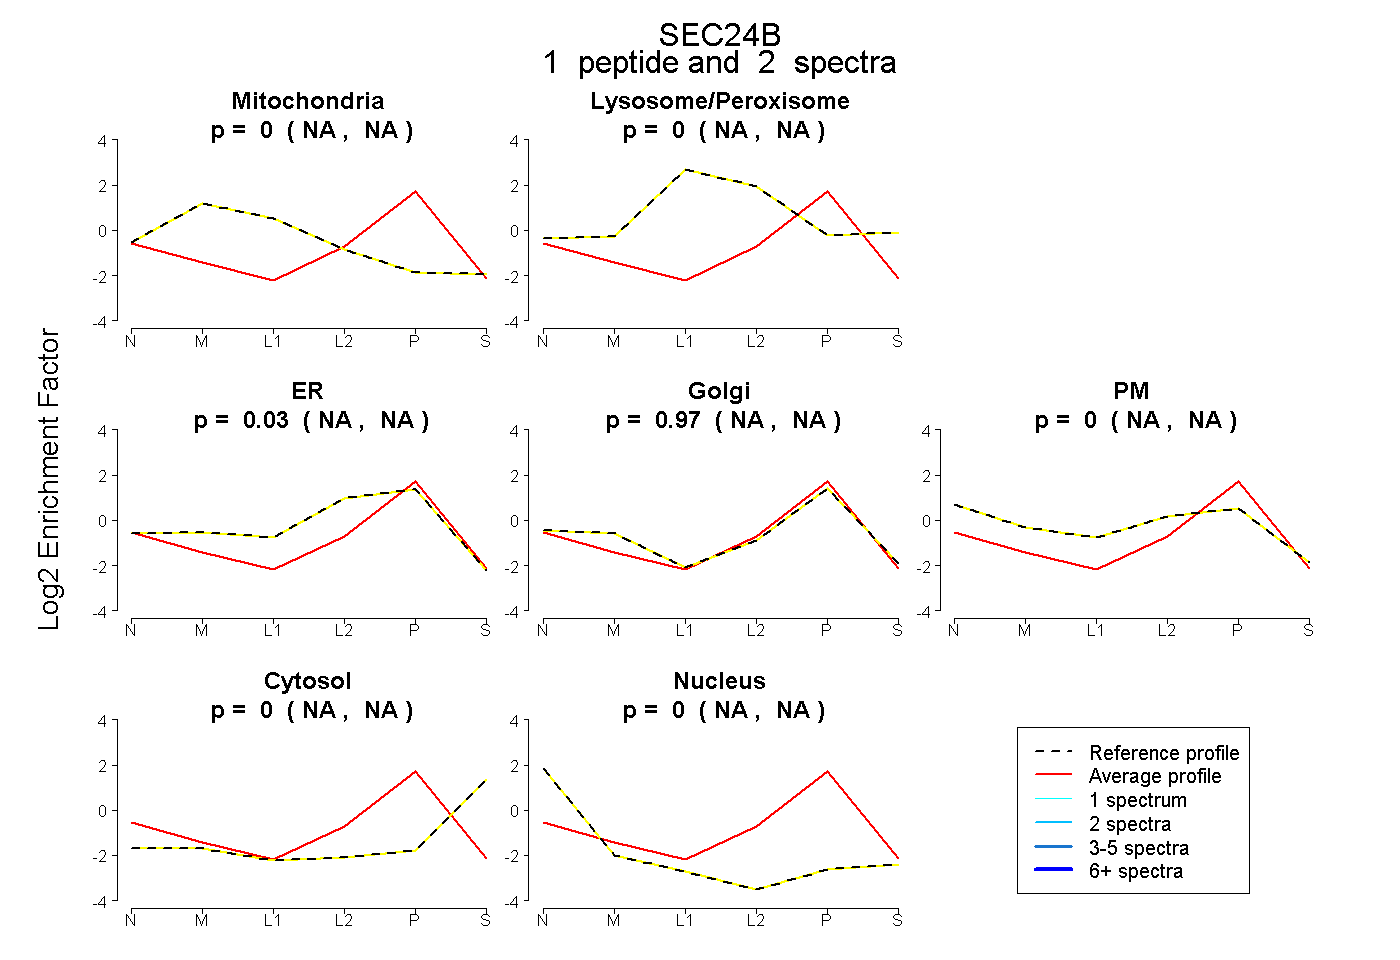
NA | NA
NA | NA
NA | NA
NA | NA
NA | NA
NA | NA
NA | NA
7peptides
spectra
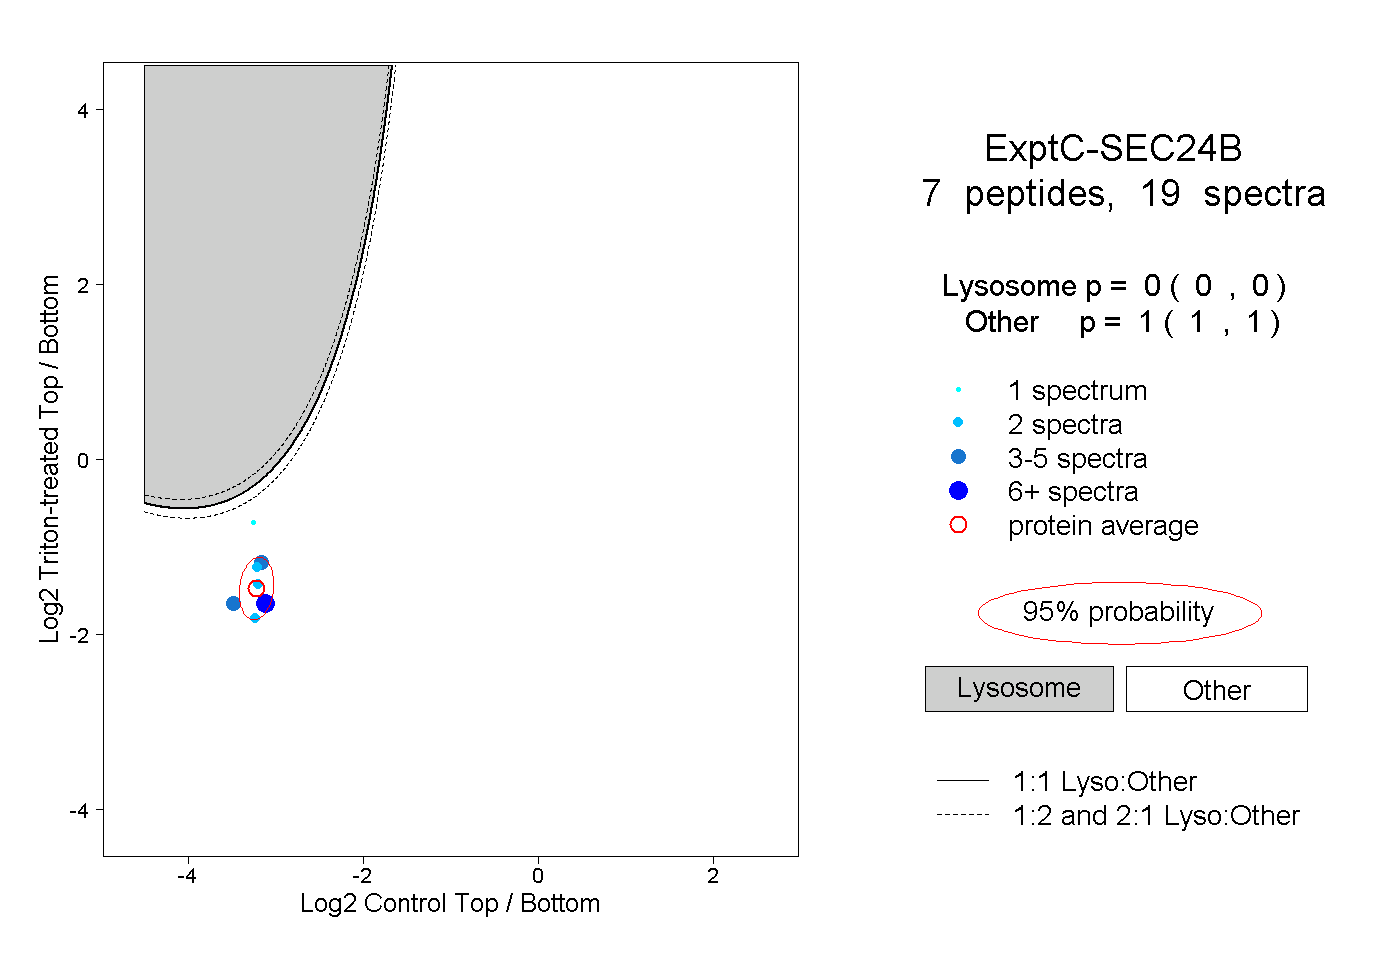
0.000 | 0.000
1.000 | 1.000
1peptide
spectrum
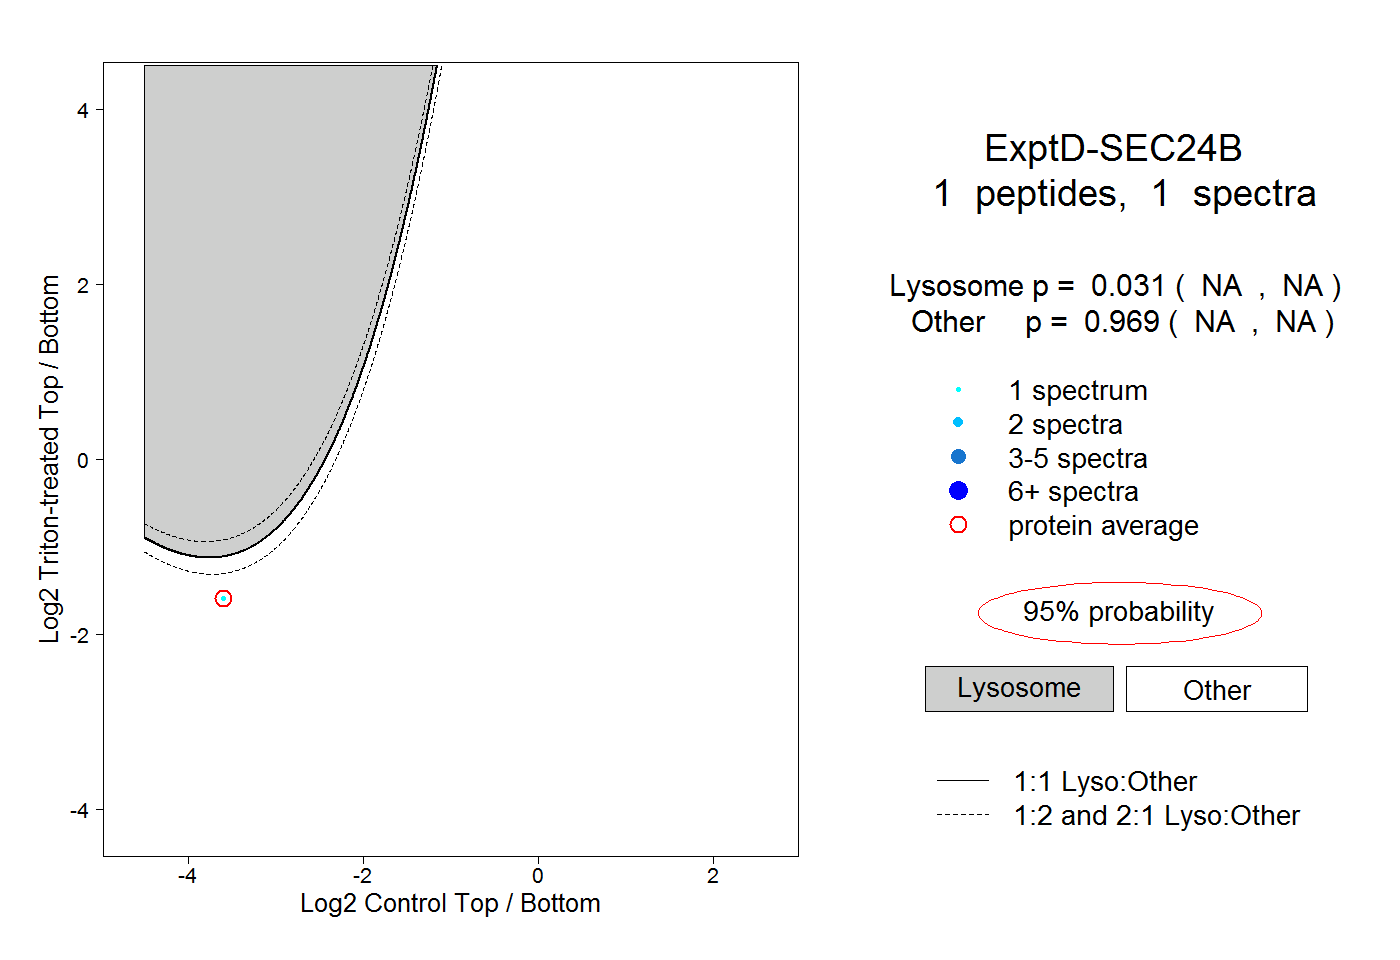
NA | NA
NA | NA