 8
8peptides
spectra
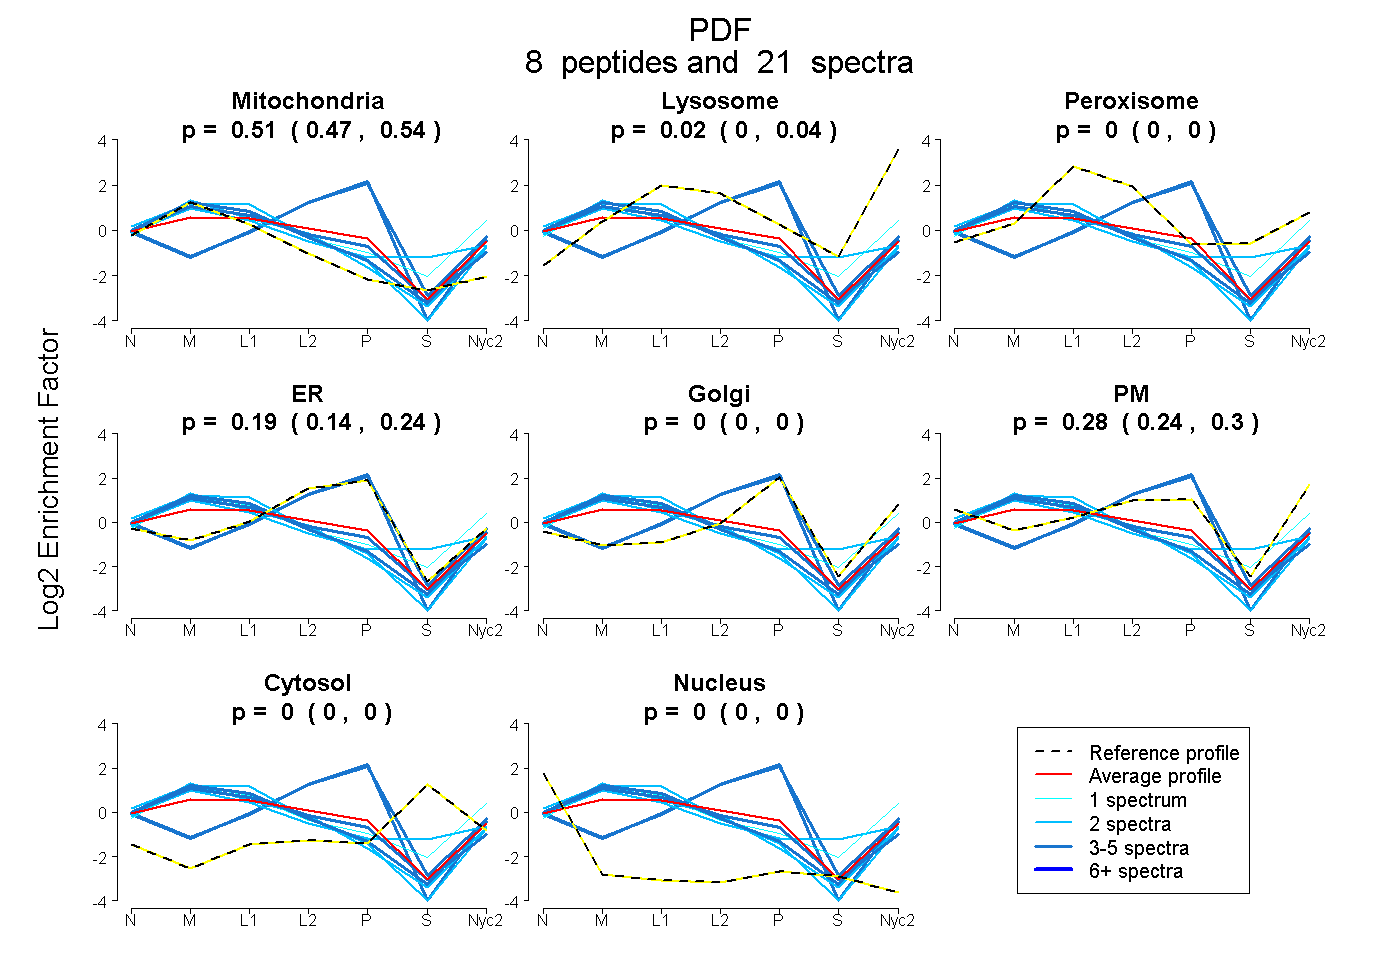
0.473 | 0.536
0.004 | 0.043
0.000 | 0.000
0.136 | 0.238
0.000 | 0.000
0.243 | 0.303
0.000 | 0.000
0.000 | 0.000
3peptides
spectra
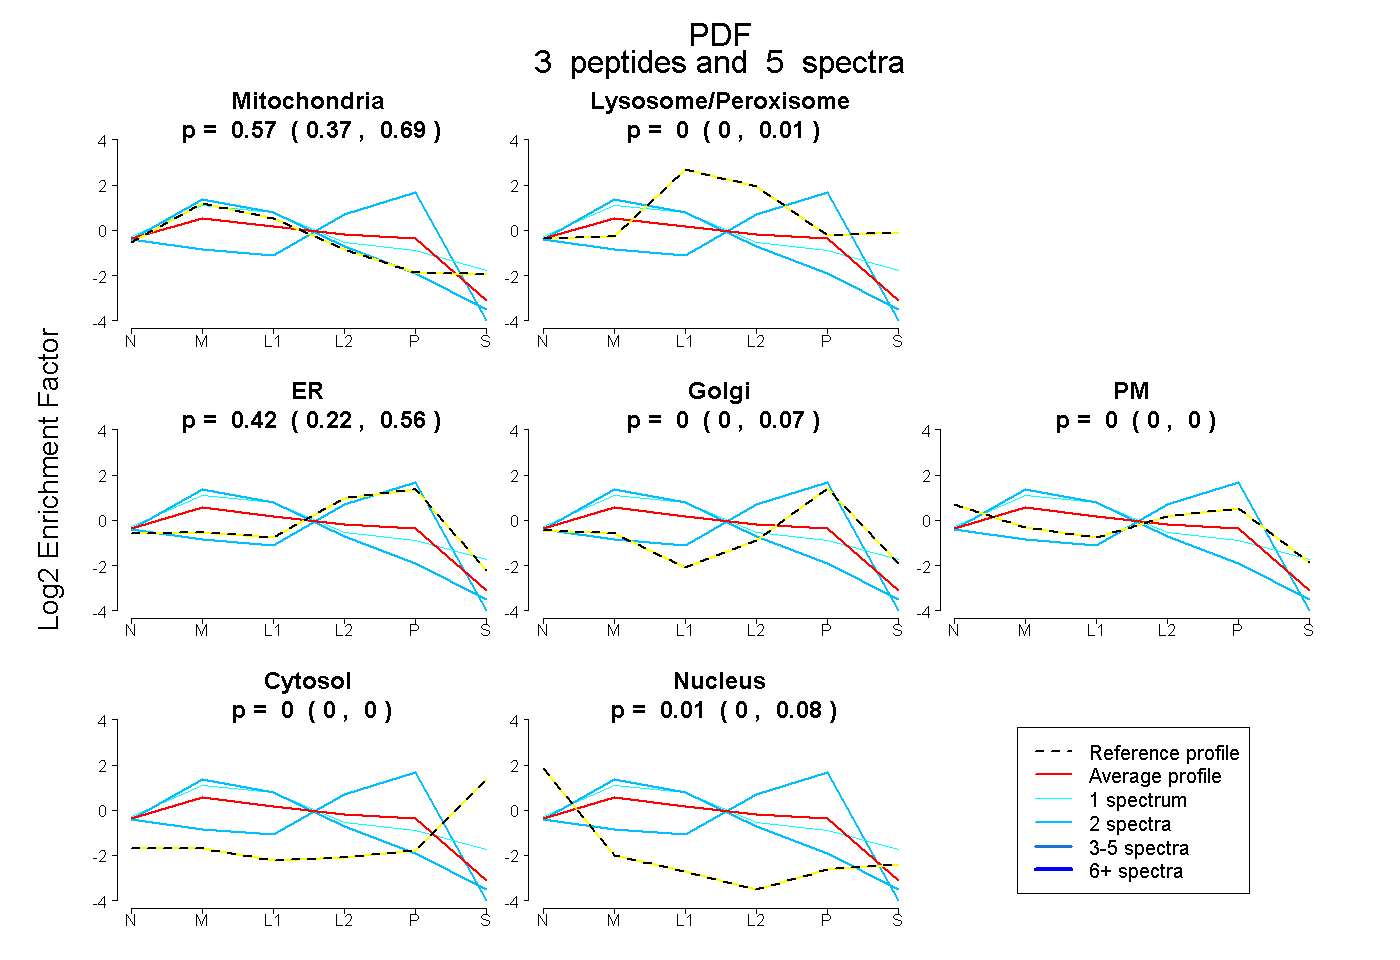
0.372 | 0.692
0.000 | 0.006
0.221 | 0.563
0.000 | 0.068
0.000 | 0.000
0.000 | 0.000
0.000 | 0.083
9peptides
spectra
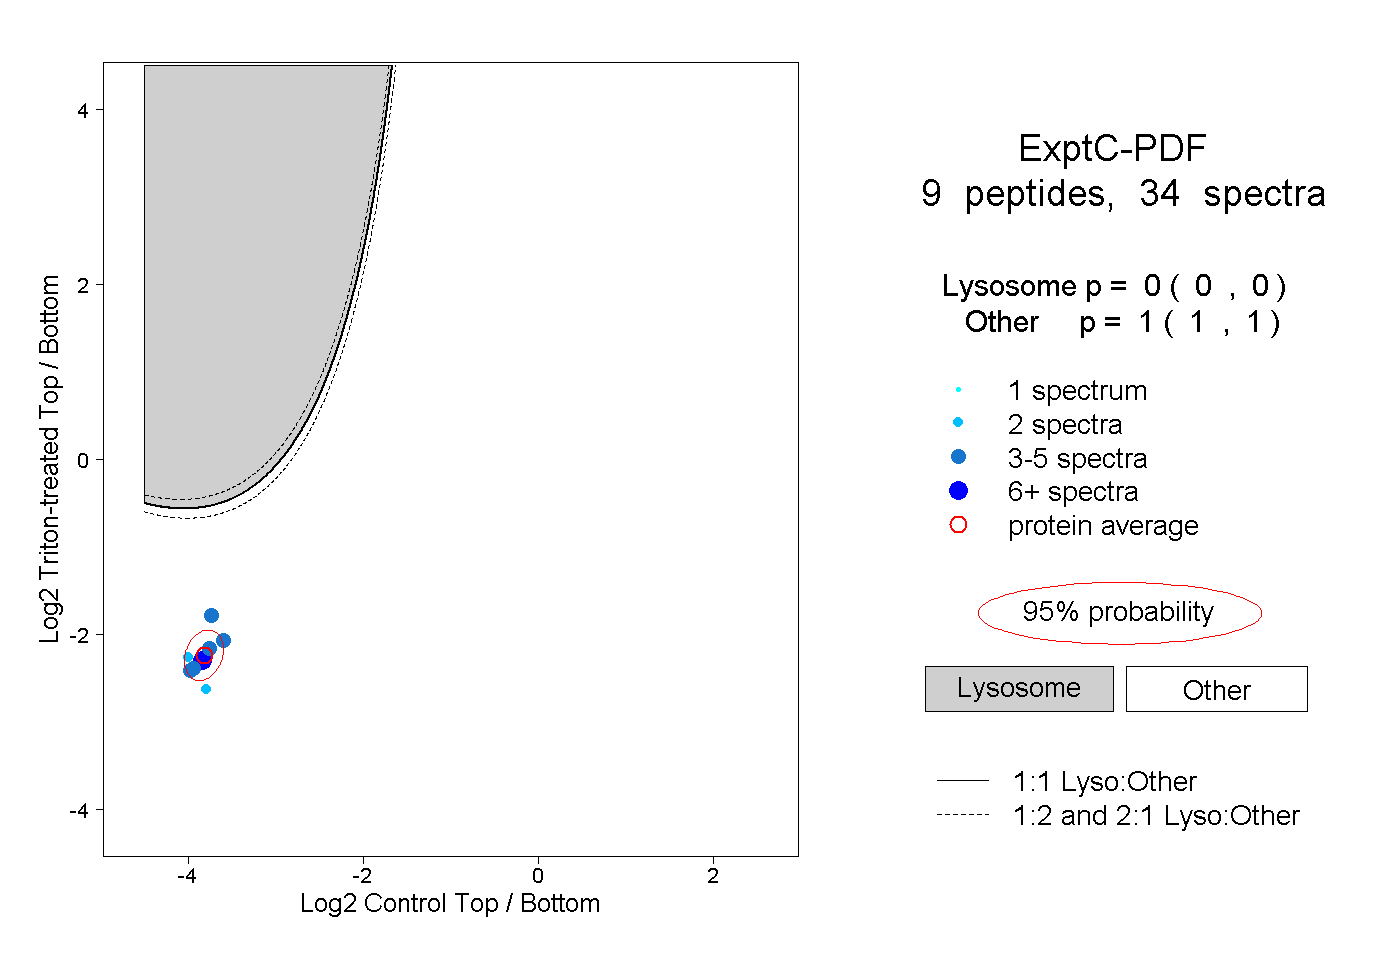
0.000 | 0.000
1.000 | 1.000
3peptides
spectra
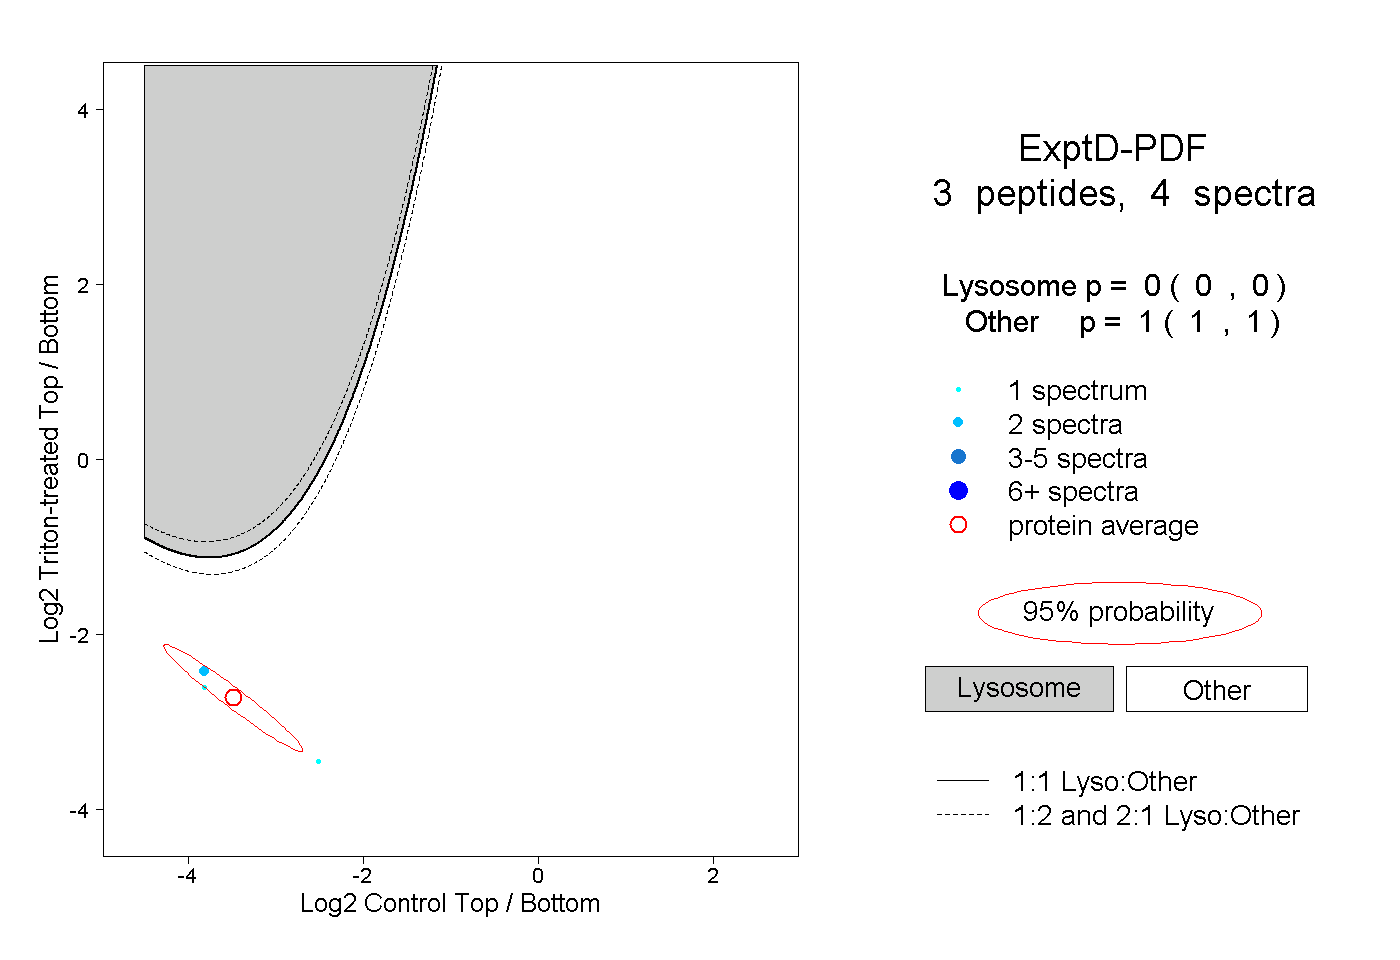
0.000 | 0.000
1.000 | 1.000