 8
8peptides
spectra
0.473 | 0.536
0.004 | 0.043
0.000 | 0.000
0.136 | 0.238
0.000 | 0.000
0.243 | 0.303
0.000 | 0.000
0.000 | 0.000
| Plot | Mito | Lyso | Perox | ER | Golgi | PM | Cytosol | Nucleus | |||||
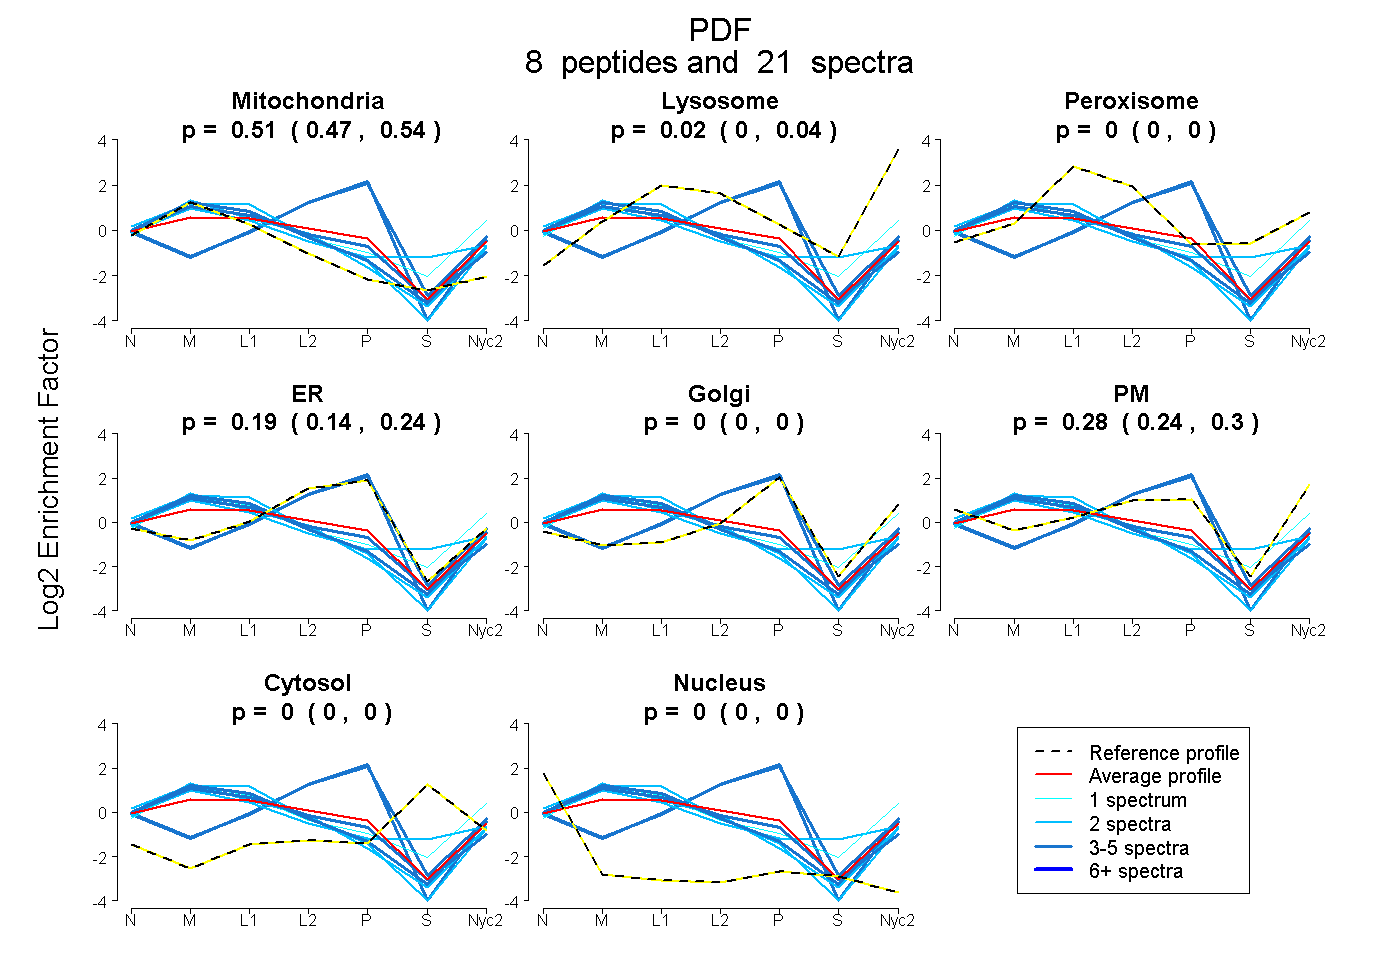
| Expt A |
8 peptides |
21 spectra |
|
0.509 0.473 | 0.536 |
0.024 0.004 | 0.043 |
0.000 0.000 | 0.000 |
0.191 0.136 | 0.238 |
0.000 0.000 | 0.000 |
0.275 0.243 | 0.303 |
0.000 0.000 | 0.000 |
0.000 0.000 | 0.000 |
| 4 spectra, VLVNPSLR | 0.686 | 0.112 | 0.000 | 0.000 | 0.000 | 0.202 | 0.000 | 0.000 | ||
| 2 spectra, LVEQLVQVMR | 0.745 | 0.090 | 0.000 | 0.000 | 0.000 | 0.165 | 0.000 | 0.000 | ||
| 4 spectra, ALLGR | 0.000 | 0.000 | 0.000 | 0.922 | 0.052 | 0.000 | 0.000 | 0.025 | ||
| 3 spectra, ALGIR | 0.000 | 0.000 | 0.000 | 0.886 | 0.088 | 0.000 | 0.000 | 0.026 | ||
| 3 spectra, VCQVGDPVLR | 0.642 | 0.009 | 0.012 | 0.147 | 0.000 | 0.190 | 0.000 | 0.000 | ||
| 1 spectrum, QMEPFPLR | 0.571 | 0.312 | 0.000 | 0.000 | 0.000 | 0.117 | 0.000 | 0.000 | ||
| 2 spectra, GAPQPPYTR | 0.719 | 0.020 | 0.000 | 0.000 | 0.000 | 0.261 | 0.000 | 0.000 | ||
| 2 spectra, QLAGPELQR | 0.567 | 0.066 | 0.156 | 0.000 | 0.000 | 0.085 | 0.127 | 0.000 |
| Plot | Mito | Lyso or Perox | ER | Golgi | PM | Cytosol | Nucleus | ||||||
| Expt B |
3 peptides |
5 spectra |
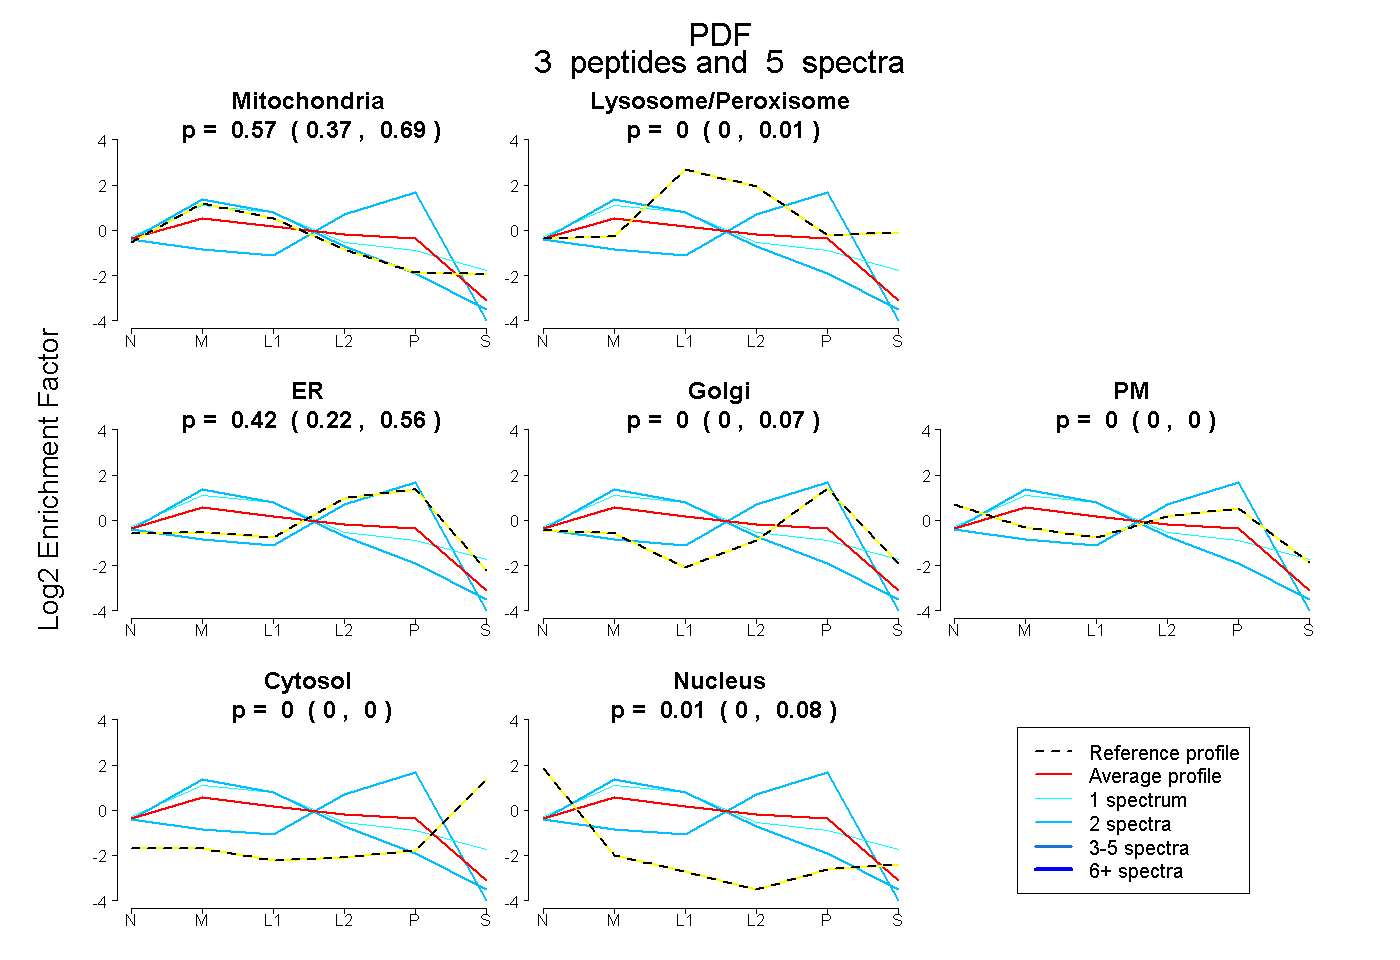 |
0.566 0.372 | 0.692 |
0.000 0.000 | 0.006 |
0.425 0.221 | 0.563 |
0.000 0.000 | 0.068 |
0.000 0.000 | 0.000 |
0.000 0.000 | 0.000 |
0.009 0.000 | 0.083 |
|||
| Plot | Lyso | Other | |||||||||||
| Expt C |
9 peptides |
34 spectra |
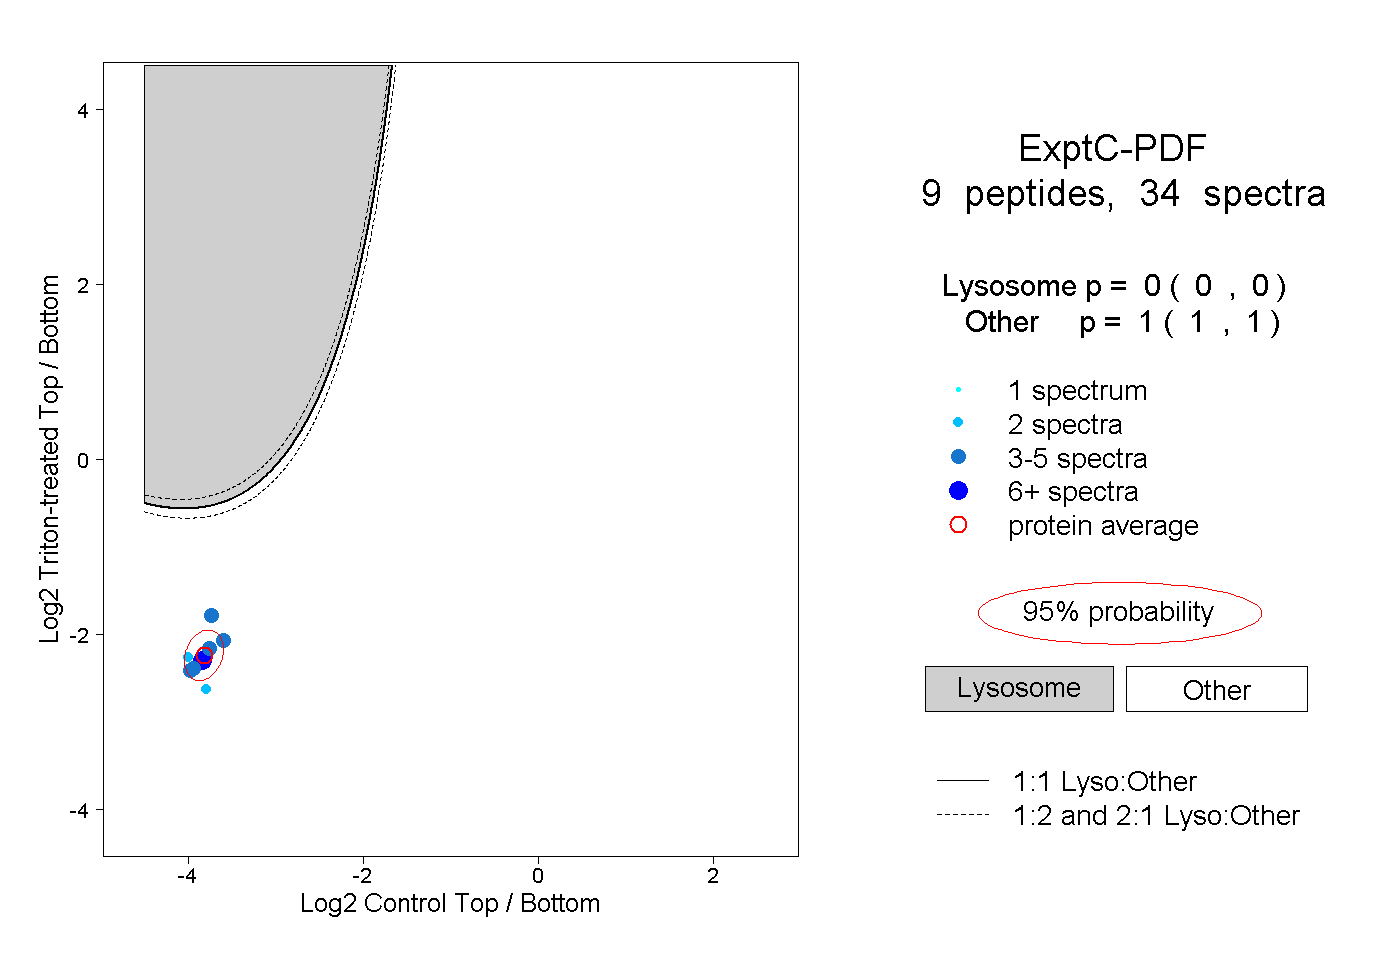 |
0.000 0.000 | 0.000 |
1.000 1.000 | 1.000 |
||||||||
| Plot | Lyso | Other | |||||||||||
| Expt D |
3 peptides |
4 spectra |
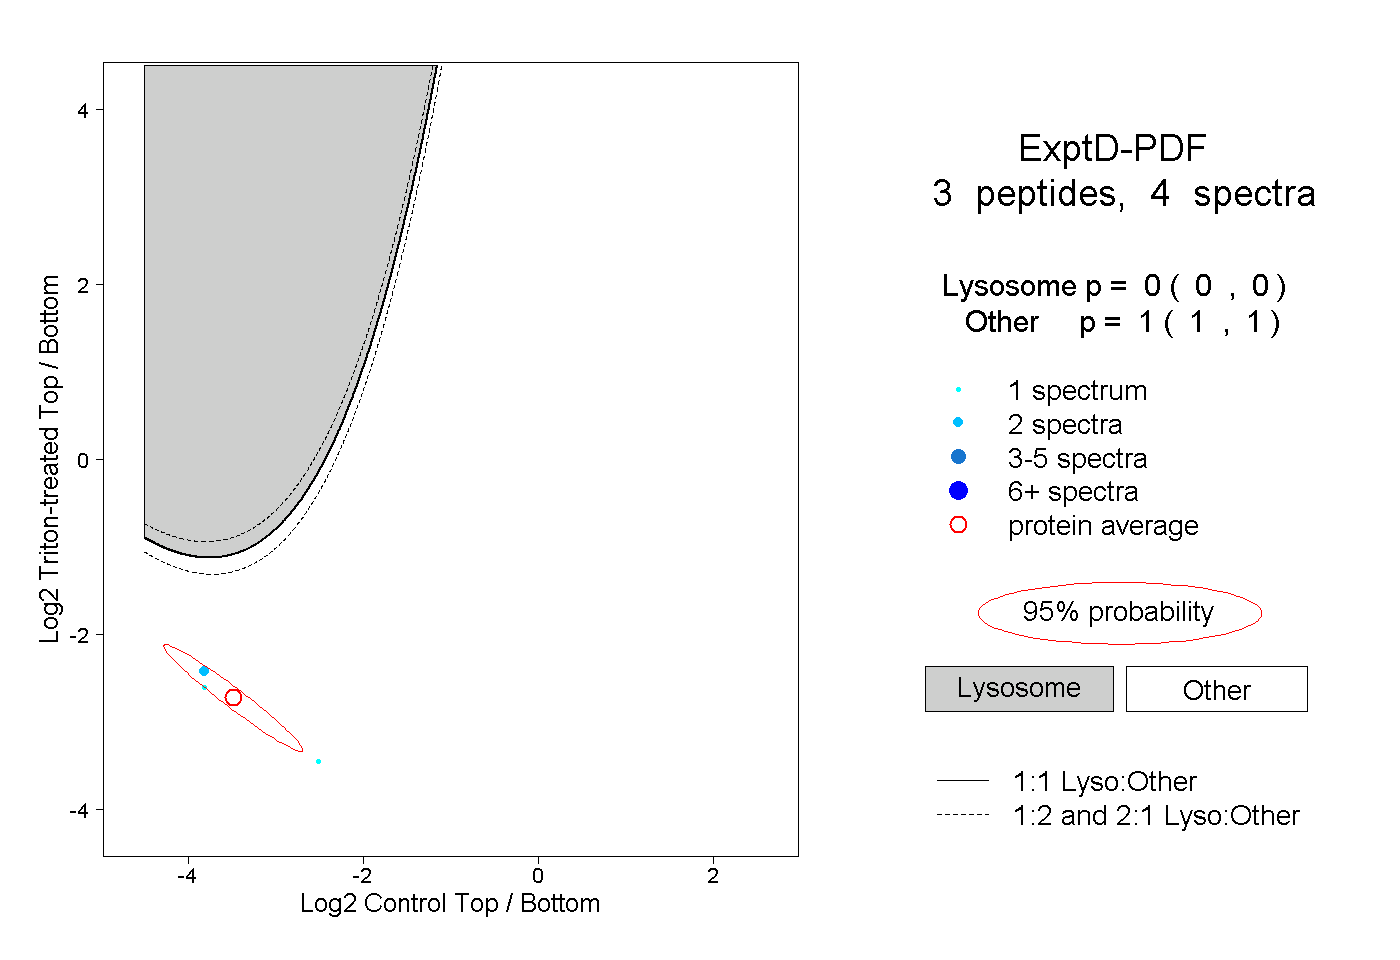 |
0.000 0.000 | 0.000 |
1.000 1.000 | 1.000 |