 7
7peptides
spectra
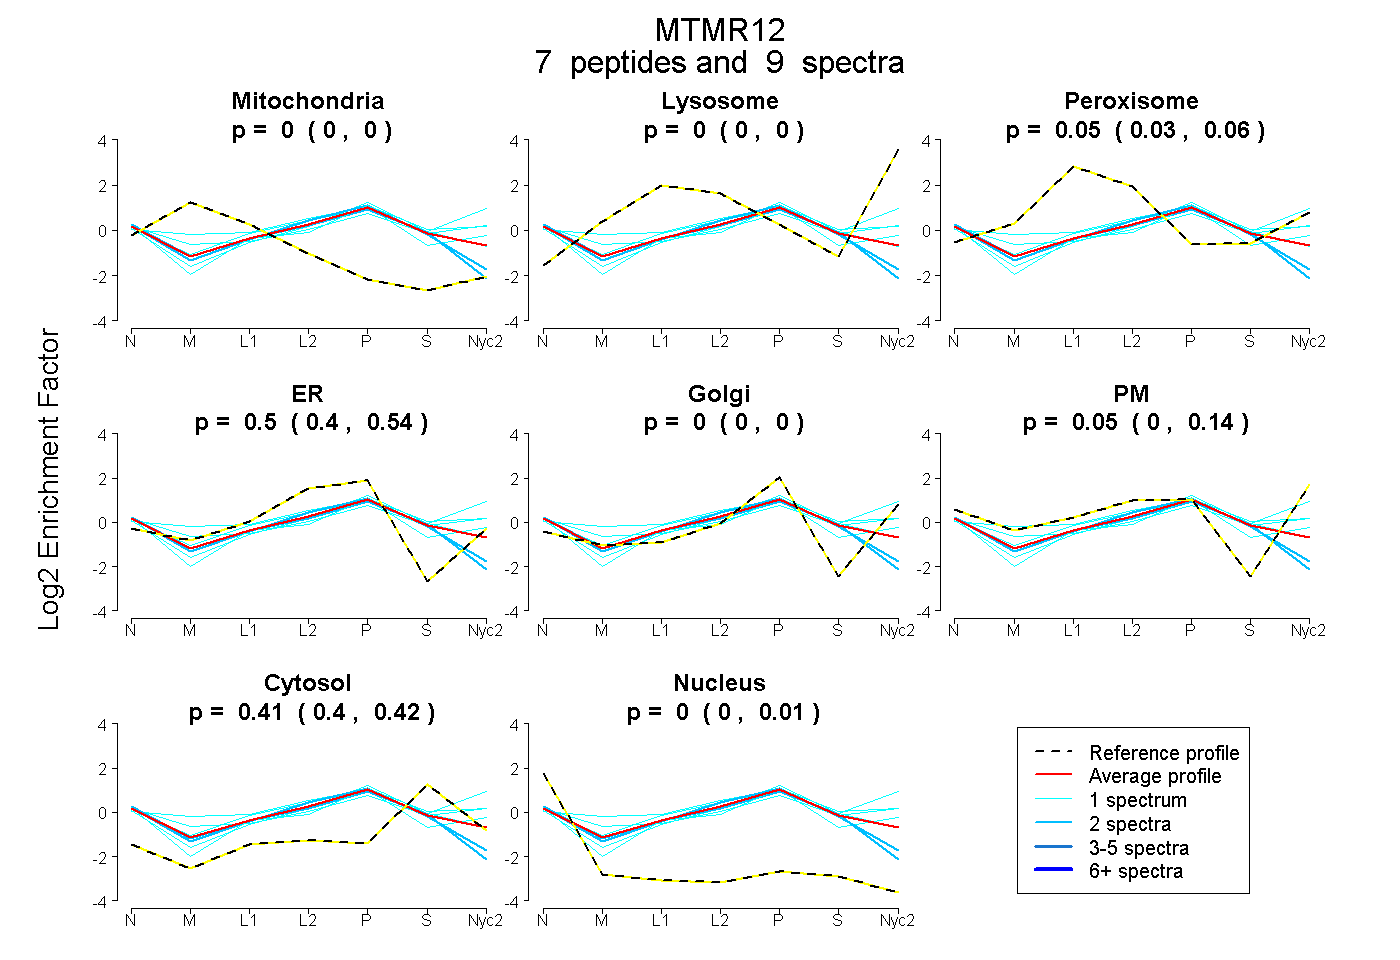
0.000 | 0.000
0.000 | 0.000
0.031 | 0.059
0.400 | 0.539
0.000 | 0.000
0.000 | 0.145
0.395 | 0.417
0.000 | 0.011
1peptide
spectra

NA | NA
NA | NA
NA | NA
NA | NA
NA | NA
NA | NA
NA | NA
4peptides
spectra
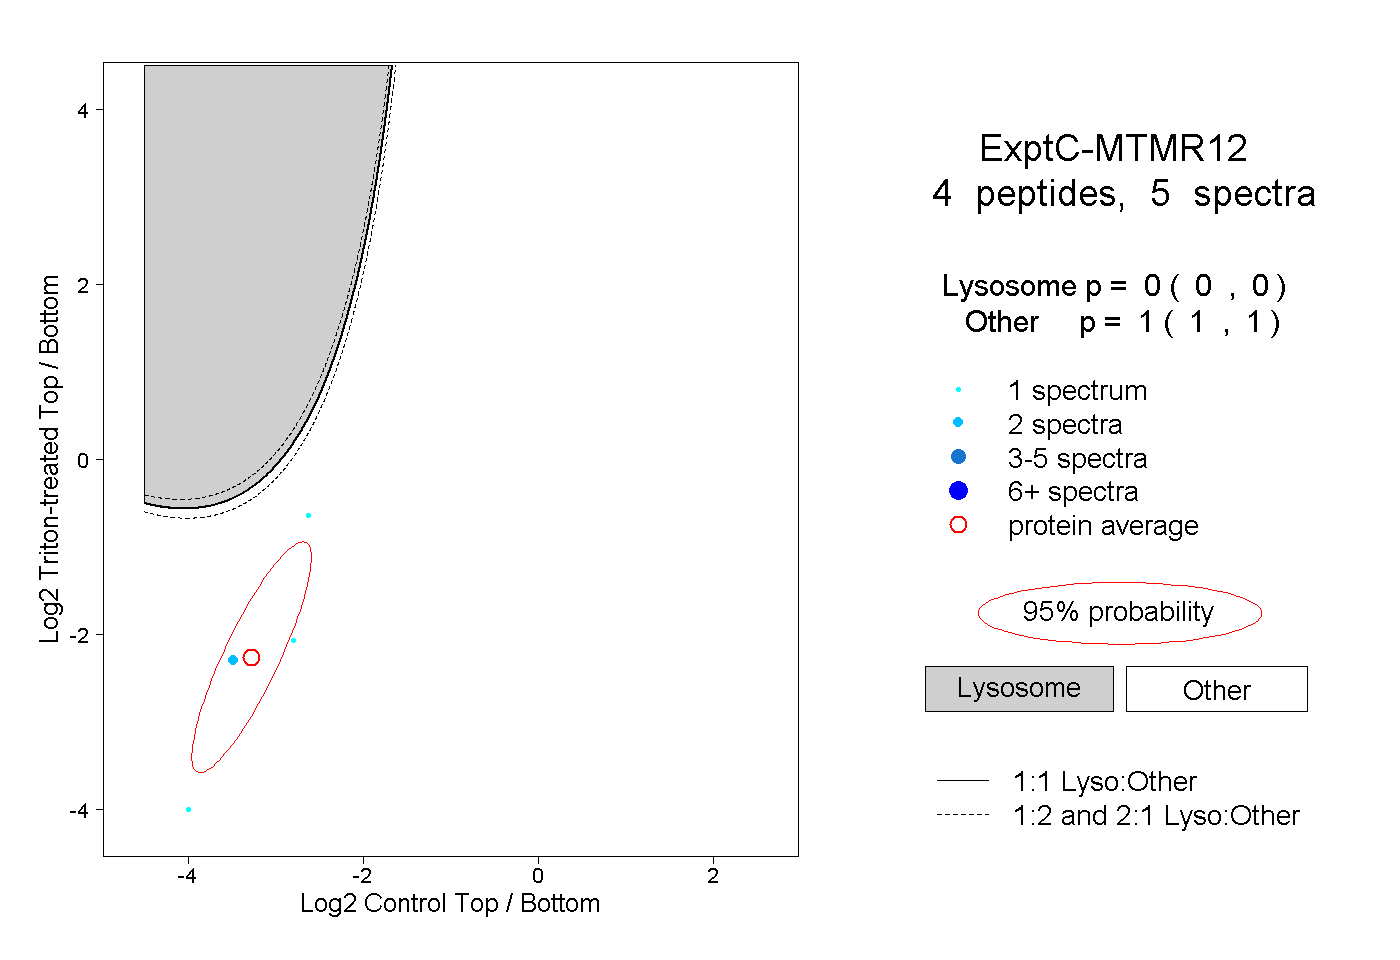
0.000 | 0.000
1.000 | 1.000
1peptide
spectrum
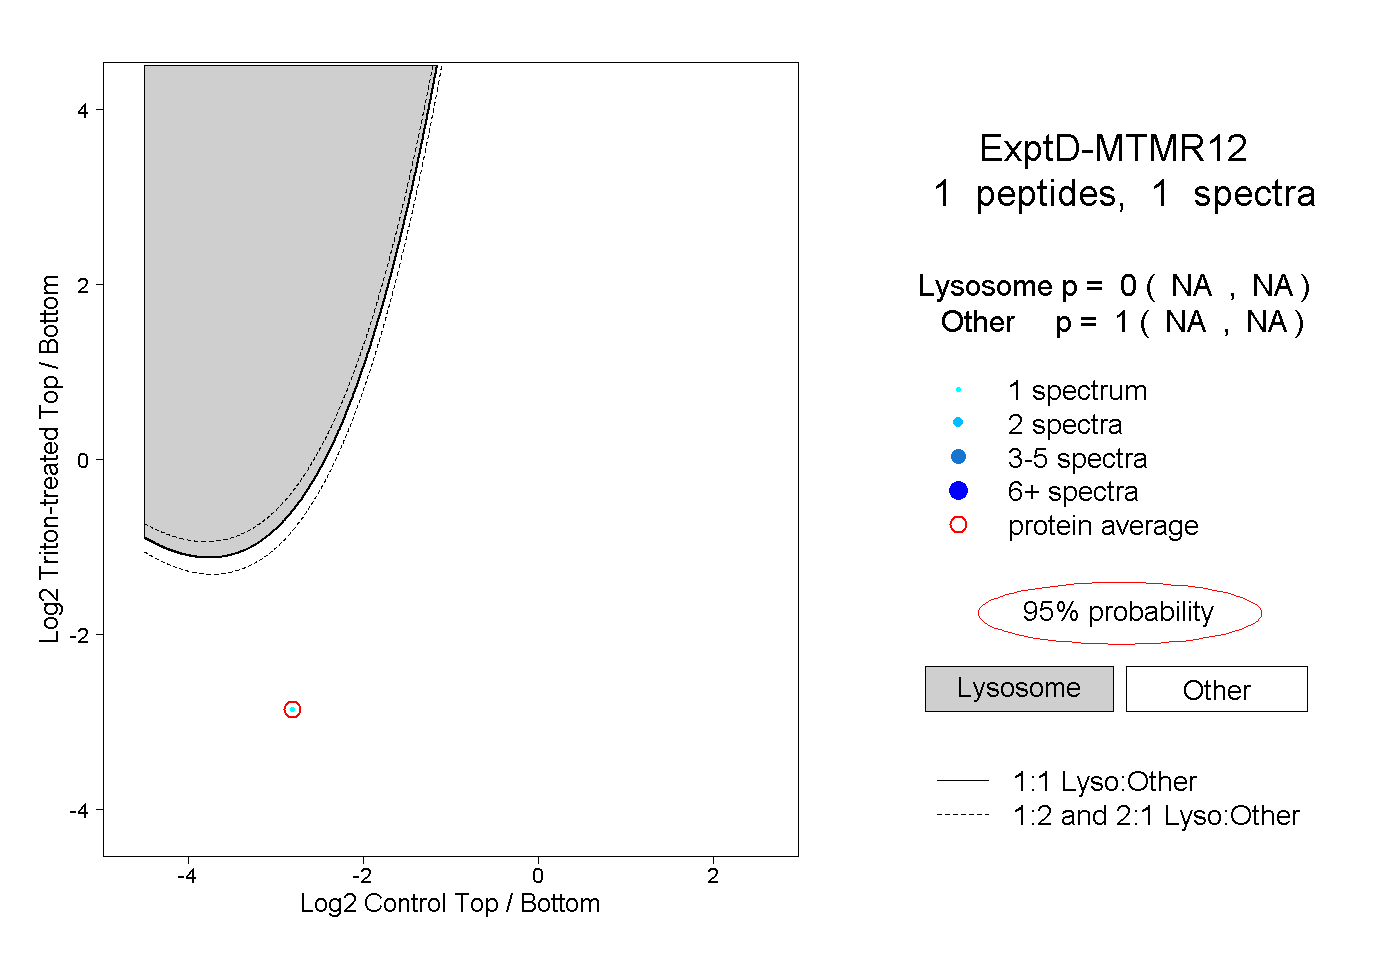
NA | NA
NA | NA