 7
7peptides
spectra
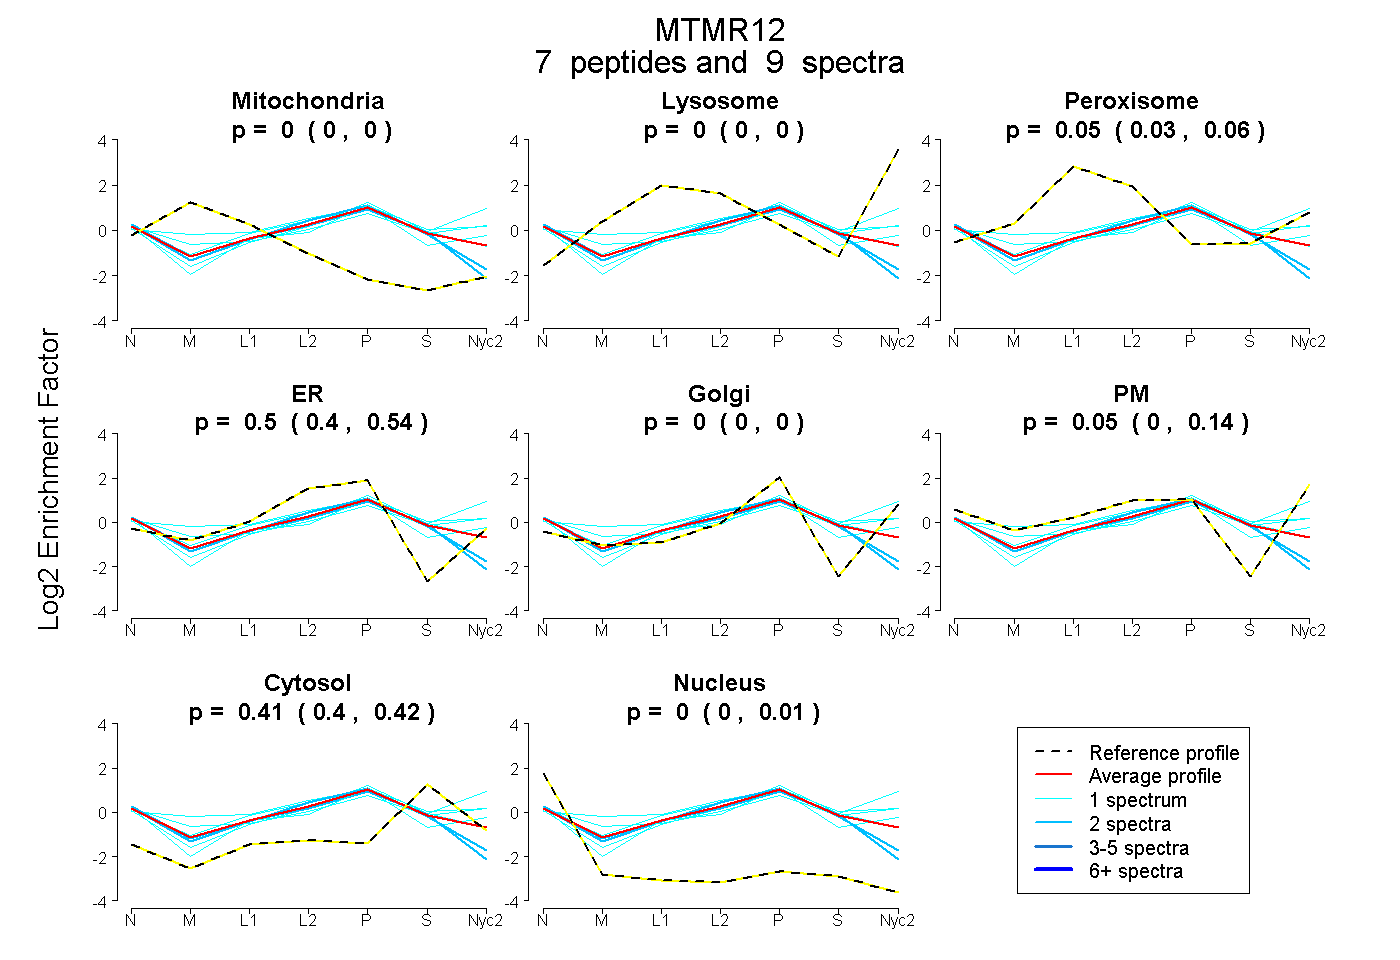
0.000 | 0.000
0.000 | 0.000
0.031 | 0.059
0.400 | 0.539
0.000 | 0.000
0.000 | 0.145
0.395 | 0.417
0.000 | 0.011
| Plot | Mito | Lyso | Perox | ER | Golgi | PM | Cytosol | Nucleus | |||||
| Expt A |
7 peptides |
9 spectra |
|
0.000 0.000 | 0.000 |
0.000 0.000 | 0.000 |
0.046 0.031 | 0.059 |
0.497 0.400 | 0.539 |
0.000 0.000 | 0.000 |
0.048 0.000 | 0.145 |
0.409 0.395 | 0.417 |
0.000 0.000 | 0.011 |
| 2 spectra, VLHFCLR | 0.000 | 0.000 | 0.044 | 0.495 | 0.000 | 0.000 | 0.363 | 0.098 | ||
| 1 spectrum, EQDDSALQIQK | 0.000 | 0.055 | 0.079 | 0.000 | 0.102 | 0.440 | 0.324 | 0.000 | ||
| 1 spectrum, WIPEAQILGGGR | 0.000 | 0.000 | 0.000 | 0.144 | 0.146 | 0.266 | 0.443 | 0.000 | ||
| 1 spectrum, EWVMGGHSFLDR | 0.049 | 0.000 | 0.197 | 0.316 | 0.205 | 0.032 | 0.201 | 0.000 | ||
| 1 spectrum, DWCWELER | 0.000 | 0.000 | 0.000 | 0.528 | 0.028 | 0.000 | 0.444 | 0.000 | ||
| 1 spectrum, TVSVNEGYR | 0.000 | 0.000 | 0.090 | 0.044 | 0.157 | 0.339 | 0.370 | 0.000 | ||
| 2 spectra, LVCTDFR | 0.000 | 0.000 | 0.003 | 0.568 | 0.000 | 0.000 | 0.381 | 0.047 |
| Plot | Mito | Lyso or Perox | ER | Golgi | PM | Cytosol | Nucleus | ||||||
| Expt B |
1 peptide |
2 spectra |
 |
0.000 NA | NA |
0.415 NA | NA |
0.000 NA | NA |
0.200 NA | NA |
0.270 NA | NA |
0.114 NA | NA |
0.000 NA | NA |
|||
| Plot | Lyso | Other | |||||||||||
| Expt C |
4 peptides |
5 spectra |
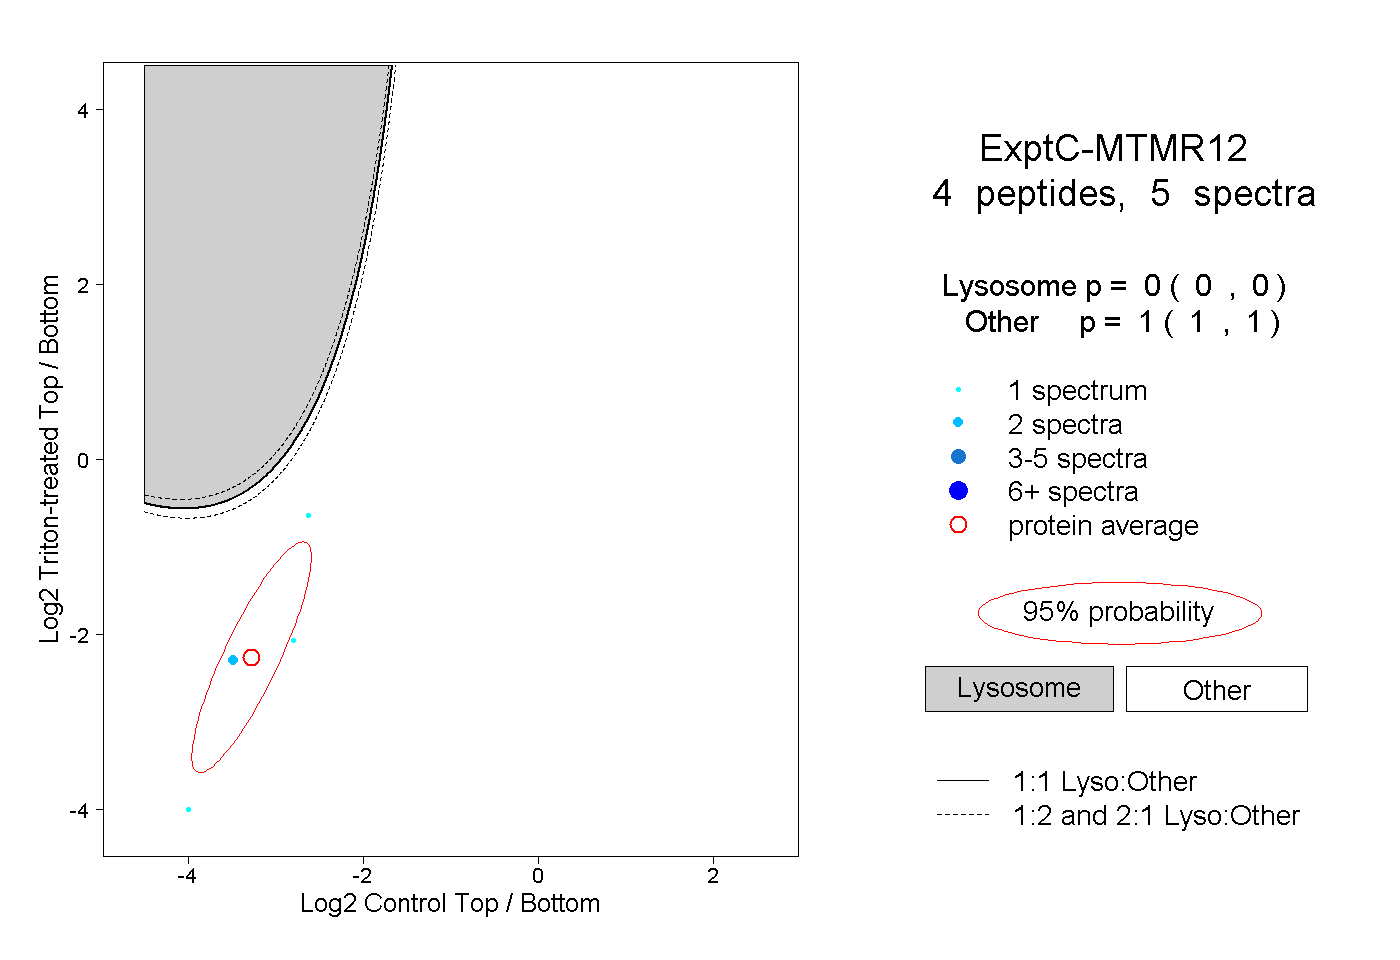 |
0.000 0.000 | 0.000 |
1.000 1.000 | 1.000 |
||||||||
| Plot | Lyso | Other | |||||||||||
| Expt D |
1 peptide |
1 spectrum |
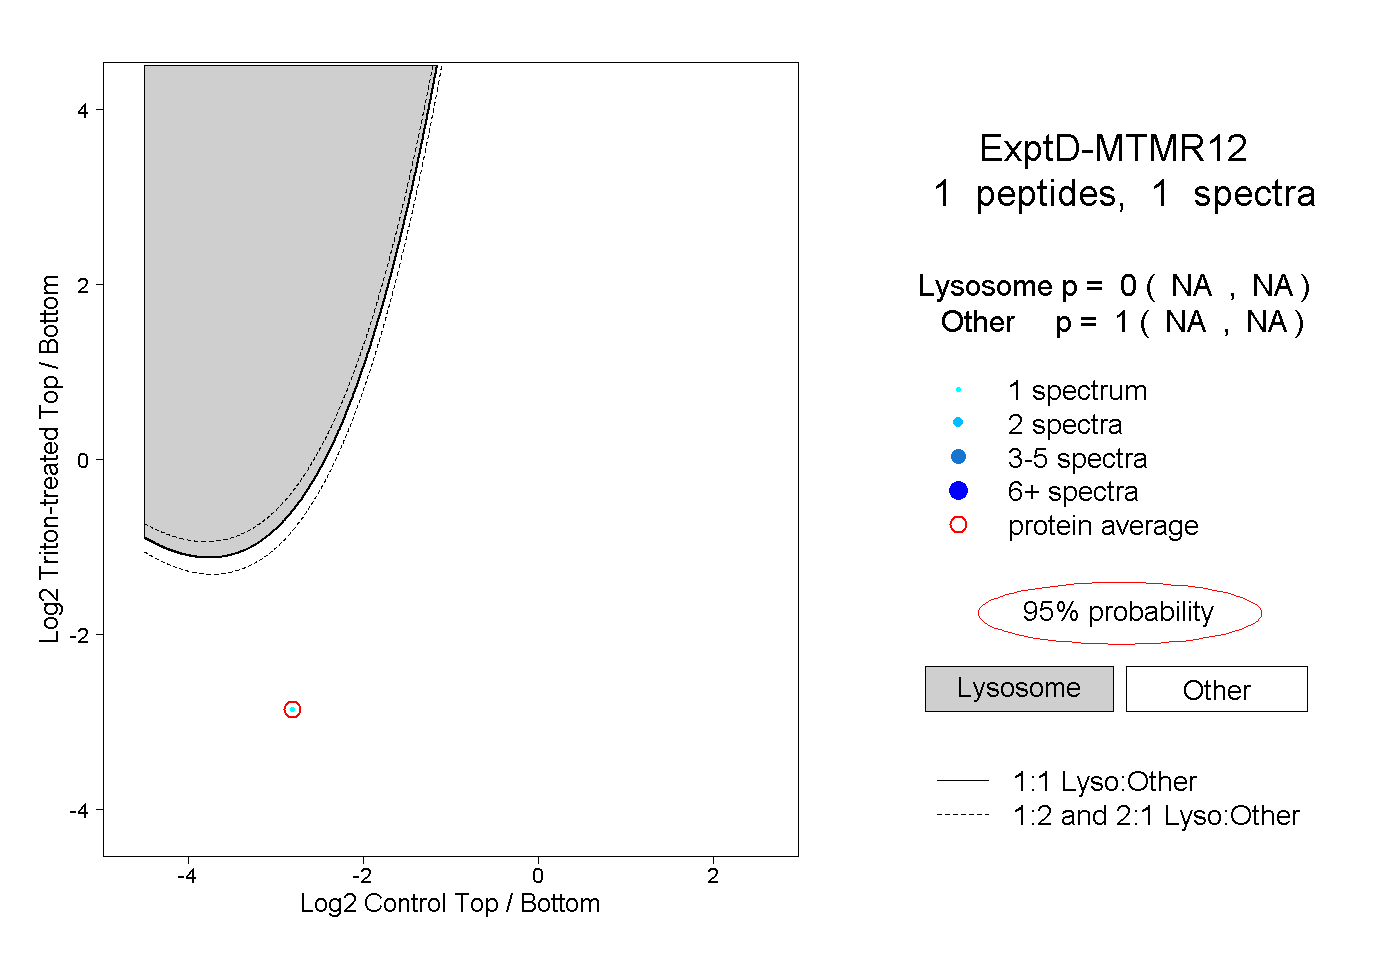 |
0.000 NA | NA |
1.000 NA | NA |