 6
6peptides
spectra
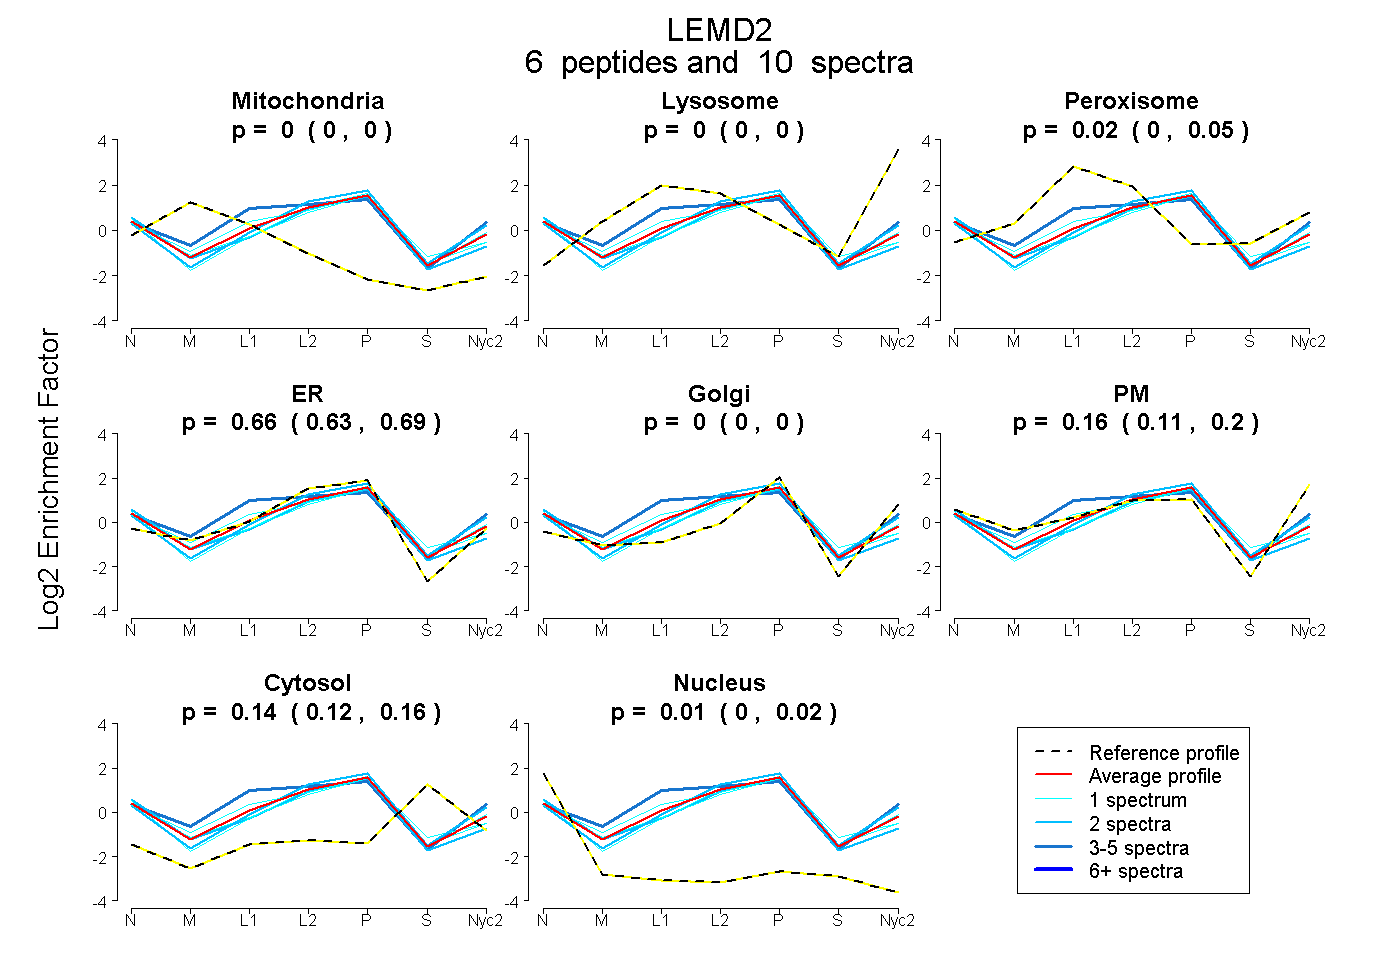
0.000 | 0.000
0.000 | 0.000
0.000 | 0.046
0.626 | 0.692
0.000 | 0.000
0.112 | 0.203
0.120 | 0.160
0.000 | 0.022
2peptides
spectra
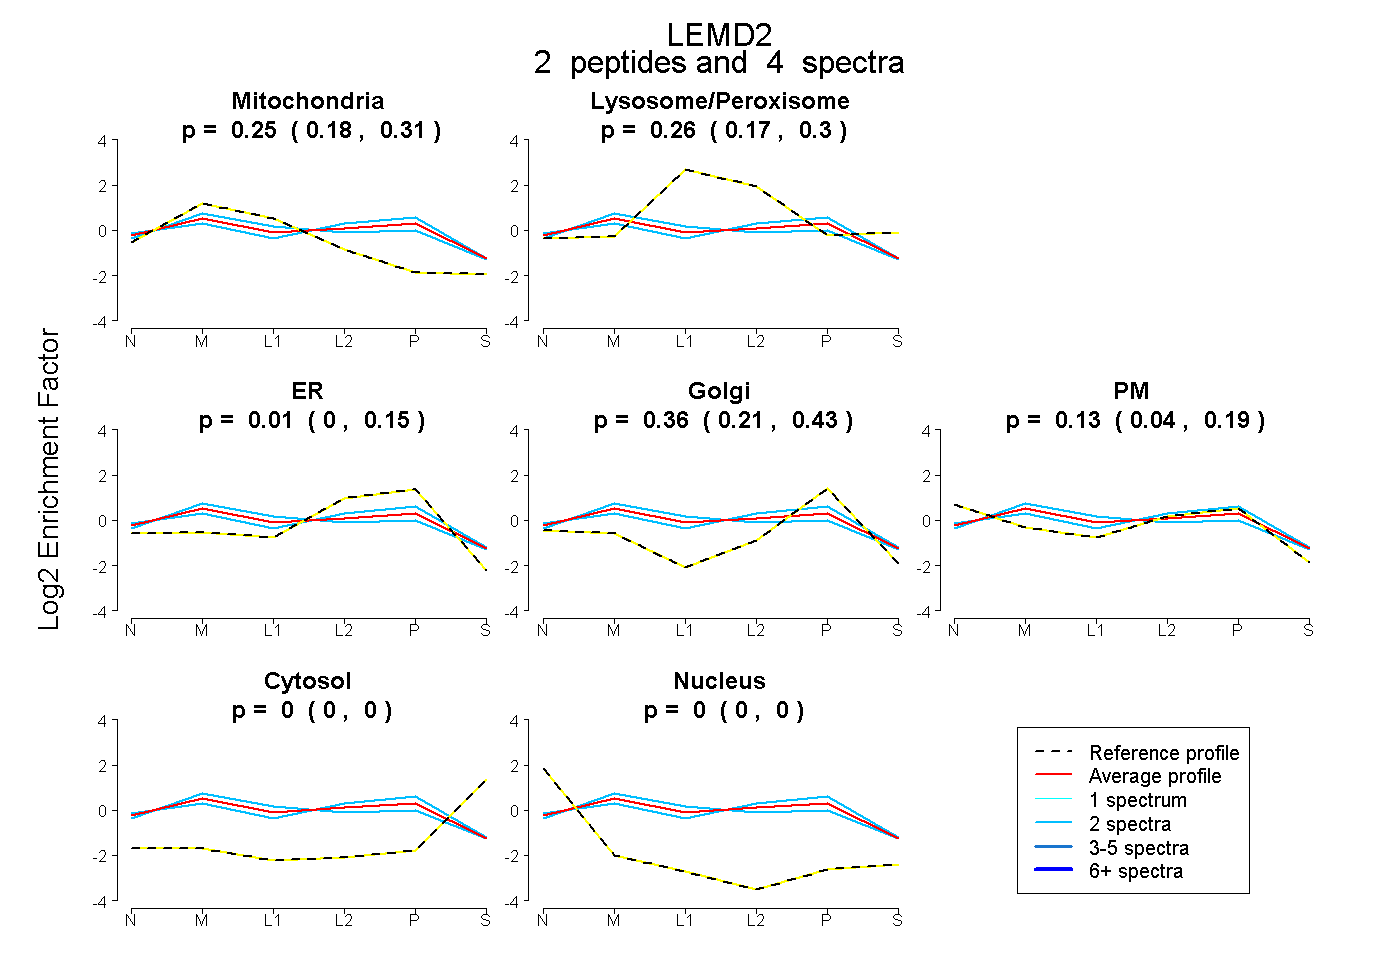
0.183 | 0.307
0.172 | 0.305
0.000 | 0.154
0.211 | 0.427
0.041 | 0.187
0.000 | 0.000
0.000 | 0.000
4peptides
spectra
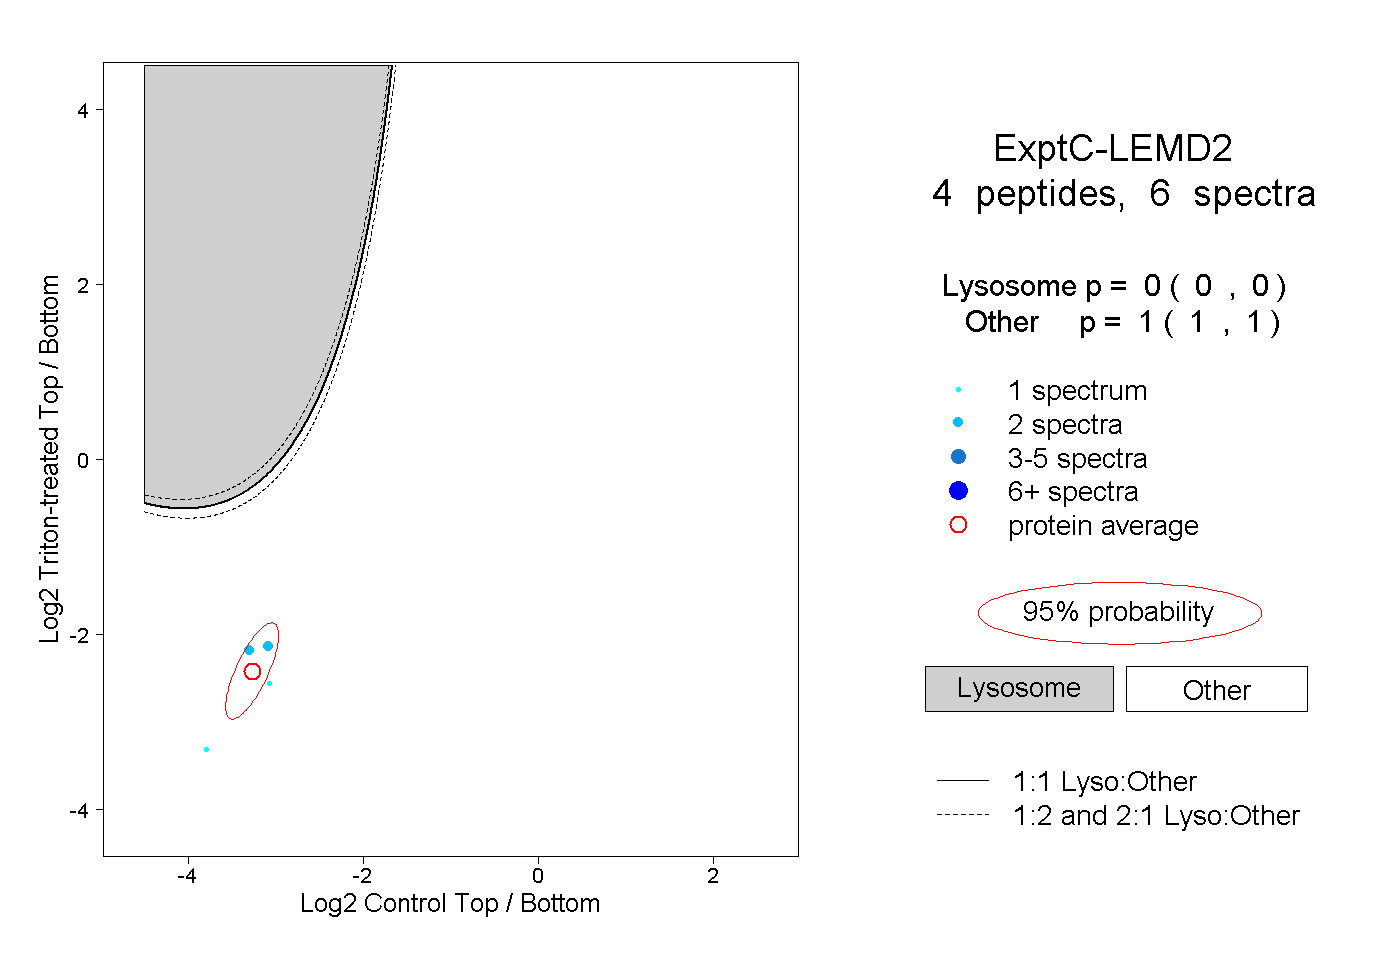
0.000 | 0.000
1.000 | 1.000