 6
6peptides
spectra
0.000 | 0.000
0.000 | 0.000
0.000 | 0.046
0.626 | 0.692
0.000 | 0.000
0.112 | 0.203
0.120 | 0.160
0.000 | 0.022
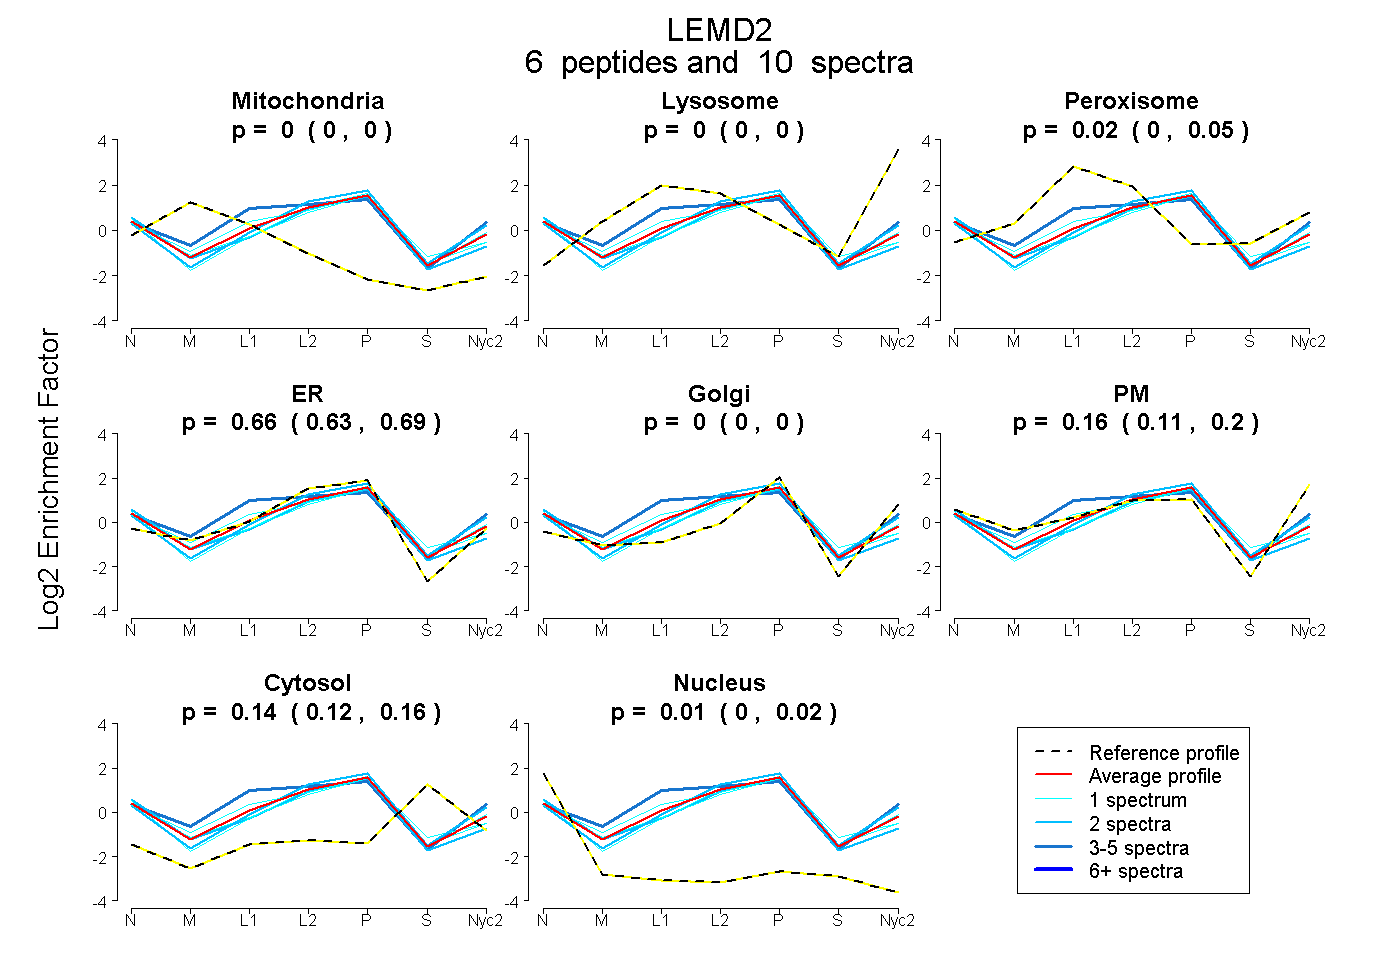
| Plot | Mito | Lyso | Perox | ER | Golgi | PM | Cytosol | Nucleus | |||||
| Expt A |
6 peptides |
10 spectra |
|
0.000 0.000 | 0.000 |
0.000 0.000 | 0.000 |
0.020 0.000 | 0.046 |
0.663 0.626 | 0.692 |
0.000 0.000 | 0.000 |
0.164 0.112 | 0.203 |
0.143 0.120 | 0.160 |
0.010 0.000 | 0.022 |
| 3 spectra, AALTWILSSNK | 0.000 | 0.000 | 0.266 | 0.425 | 0.076 | 0.217 | 0.002 | 0.014 | ||
| 1 spectrum, YPYVGILHVR | 0.000 | 0.000 | 0.104 | 0.586 | 0.057 | 0.141 | 0.099 | 0.012 | ||
| 1 spectrum, DVGIWLK | 0.000 | 0.000 | 0.000 | 0.694 | 0.000 | 0.071 | 0.227 | 0.007 | ||
| 2 spectra, AVEFLASNESR | 0.000 | 0.000 | 0.000 | 0.775 | 0.000 | 0.039 | 0.102 | 0.083 | ||
| 1 spectrum, GEDPSELVTTVDK | 0.000 | 0.000 | 0.000 | 0.764 | 0.000 | 0.025 | 0.171 | 0.040 | ||
| 2 spectra, LLPVDCER | 0.000 | 0.000 | 0.000 | 0.626 | 0.000 | 0.225 | 0.148 | 0.000 |
| Plot | Mito | Lyso or Perox | ER | Golgi | PM | Cytosol | Nucleus | ||||||
| Expt B |
2 peptides |
4 spectra |
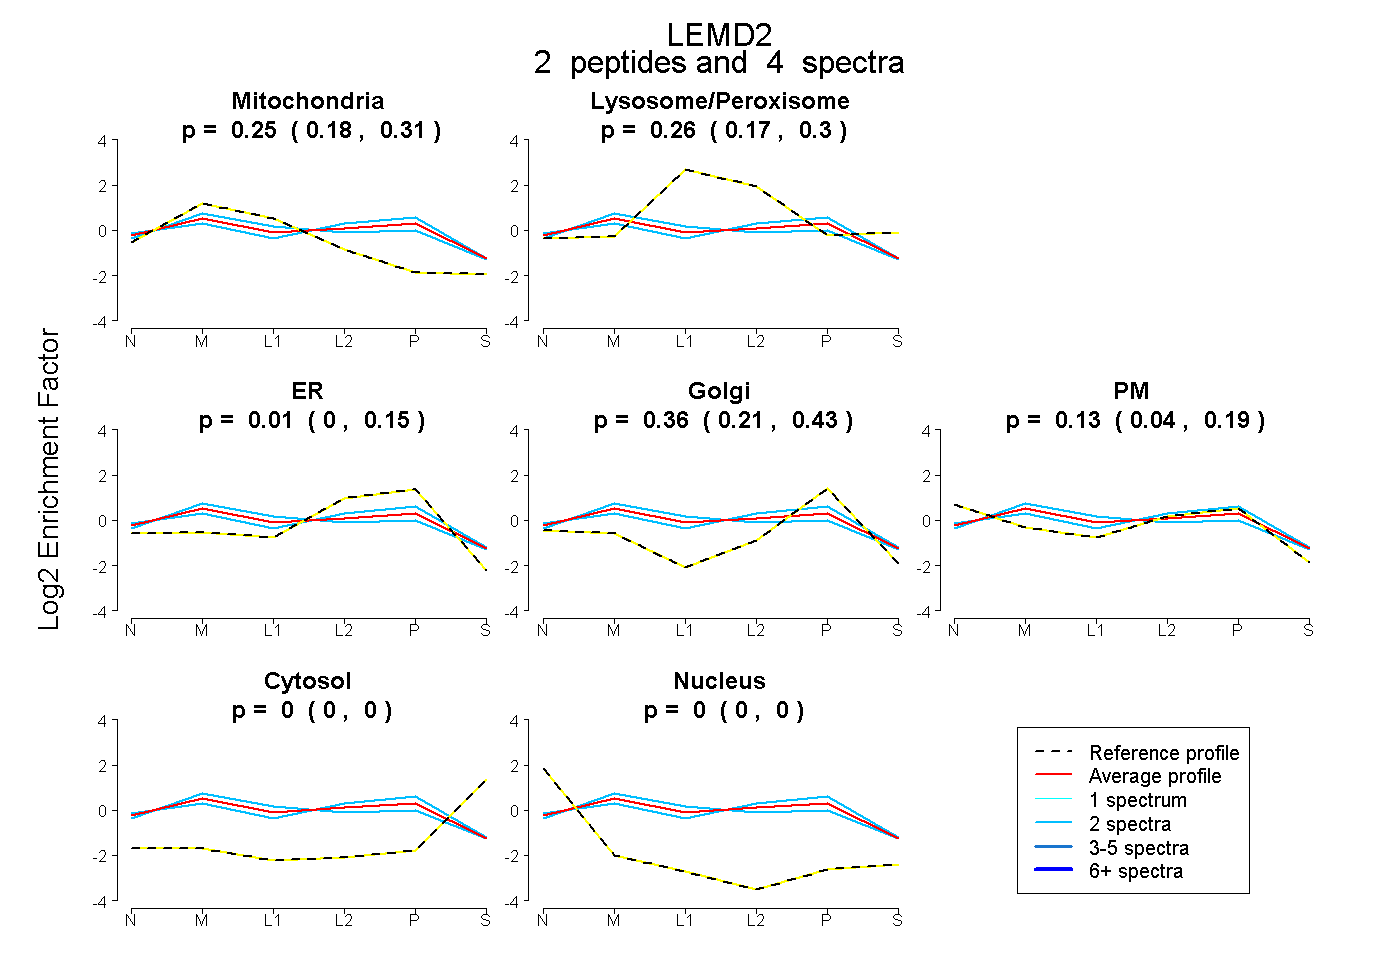 |
0.245 0.183 | 0.307 |
0.260 0.172 | 0.305 |
0.009 0.000 | 0.154 |
0.357 0.211 | 0.427 |
0.129 0.041 | 0.187 |
0.000 0.000 | 0.000 |
0.000 0.000 | 0.000 |
|||
| Plot | Lyso | Other | |||||||||||
| Expt C |
4 peptides |
6 spectra |
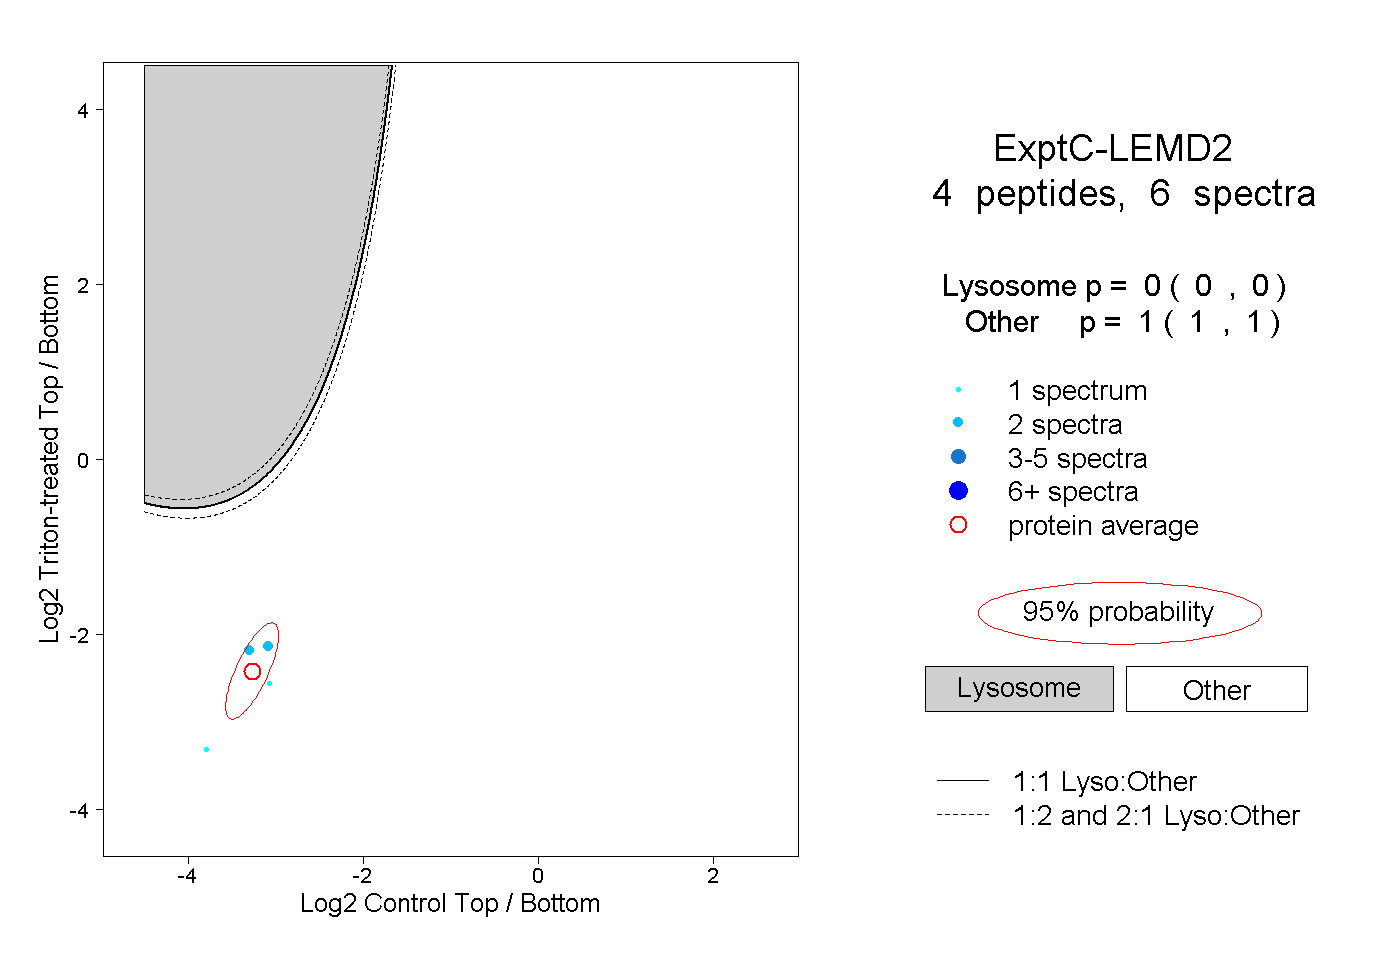 |
0.000 0.000 | 0.000 |
1.000 1.000 | 1.000 |