 13
13peptides
spectra
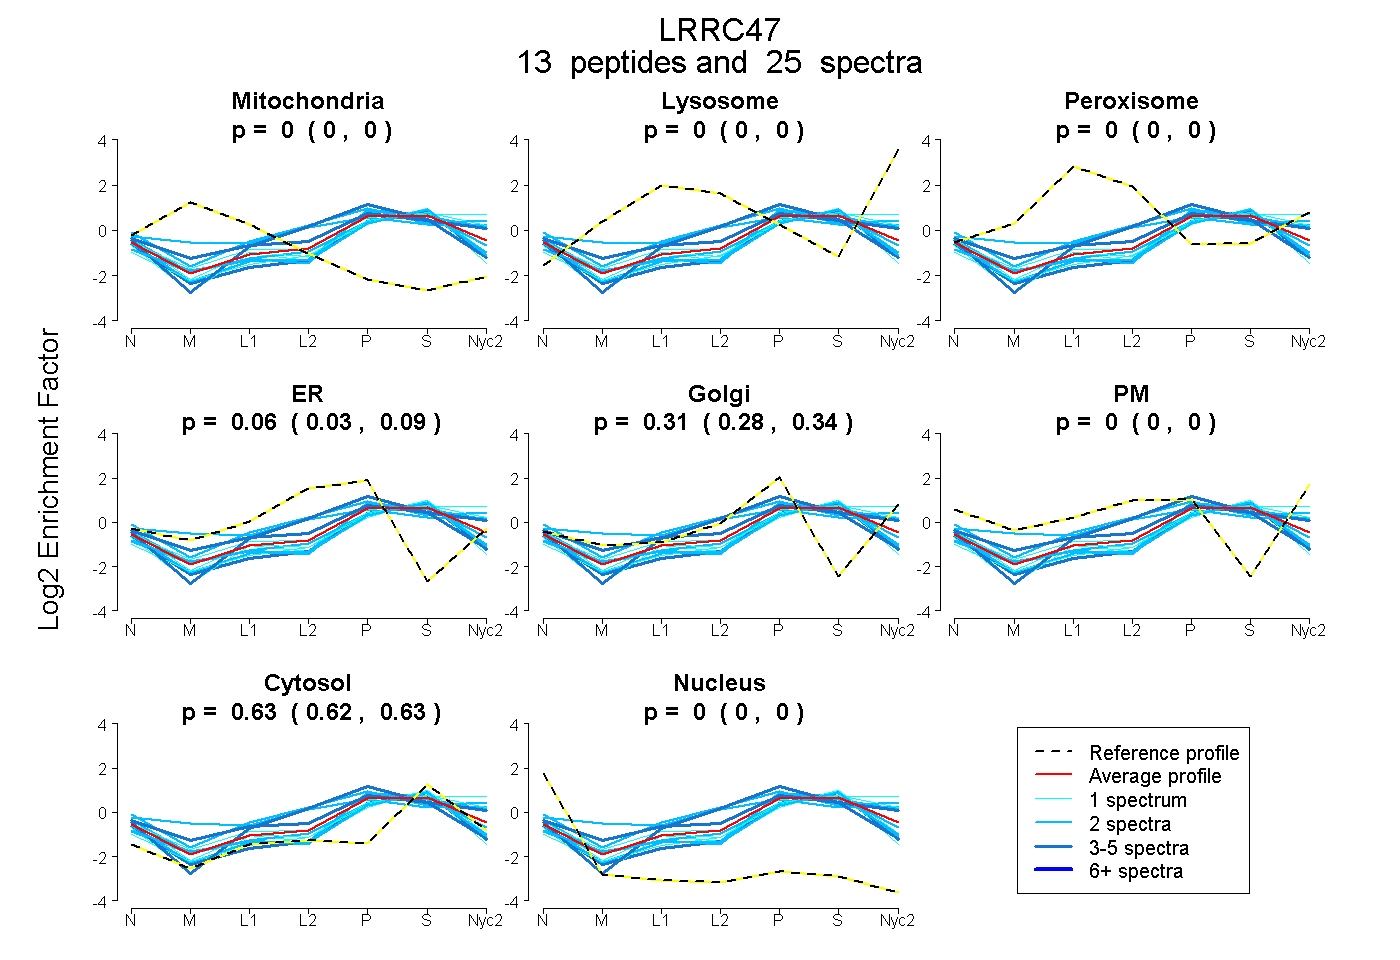
0.000 | 0.000
0.000 | 0.000
0.000 | 0.002
0.027 | 0.086
0.277 | 0.342
0.000 | 0.000
0.620 | 0.635
0.000 | 0.000
5peptides
spectra
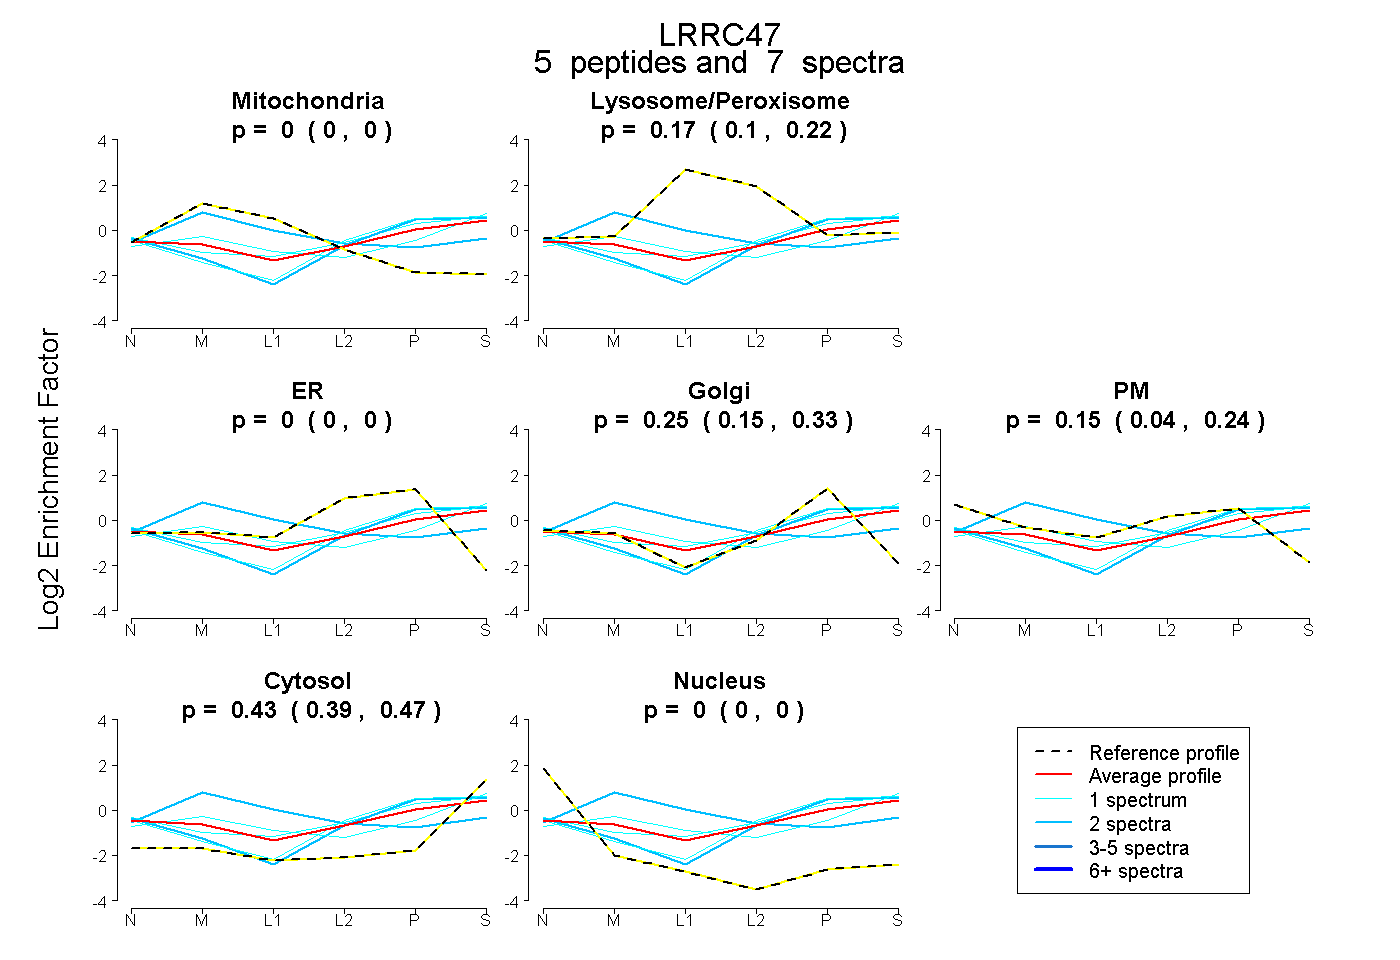
0.000 | 0.000
0.105 | 0.220
0.000 | 0.000
0.153 | 0.334
0.043 | 0.242
0.391 | 0.467
0.000 | 0.000
10peptides
spectra
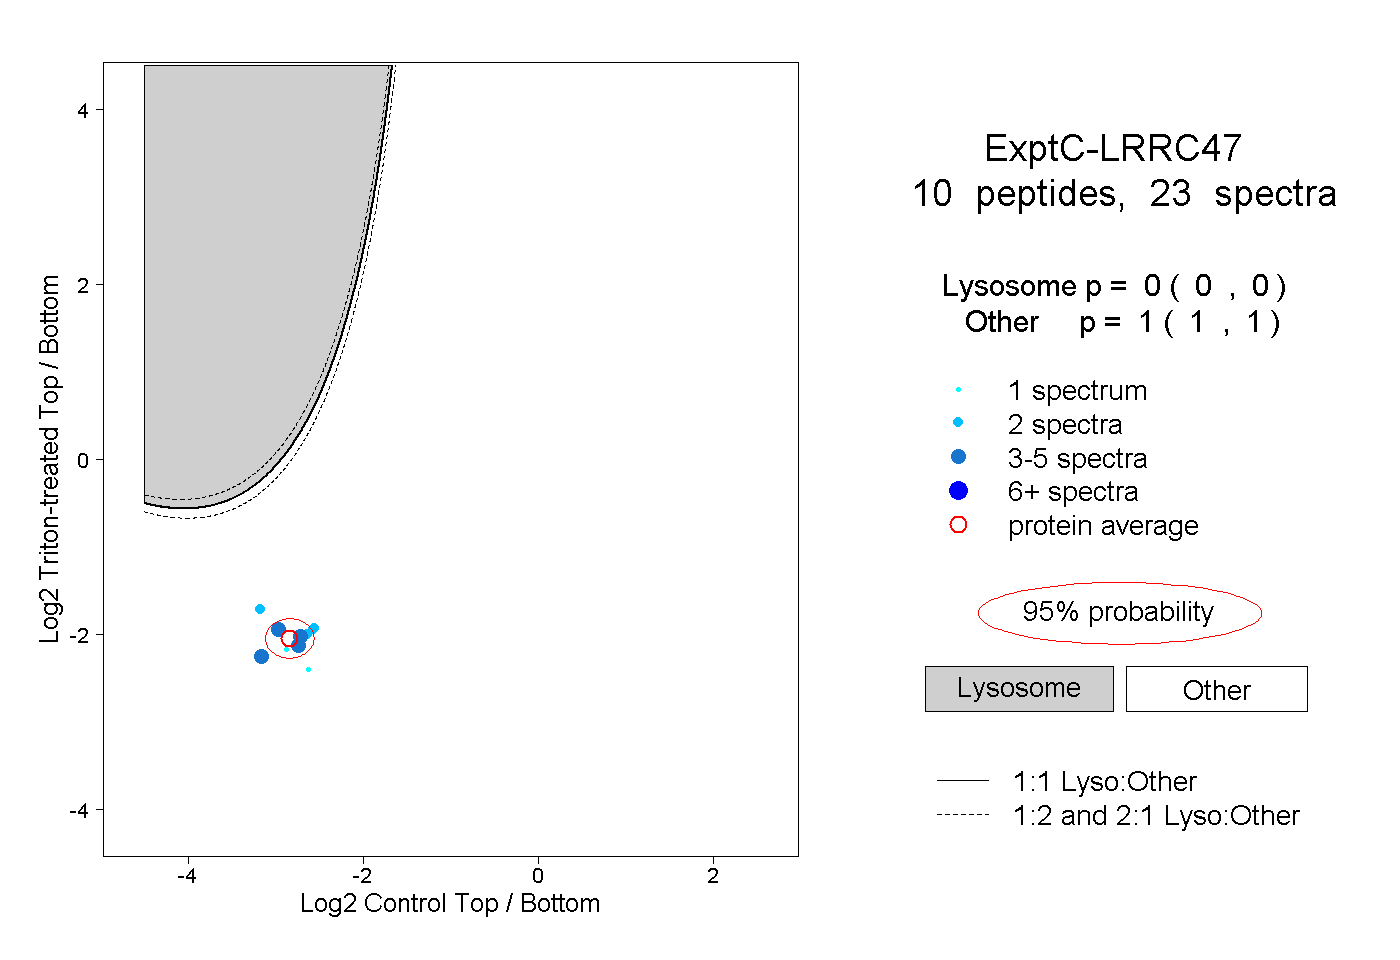
0.000 | 0.000
1.000 | 1.000
1peptide
spectra
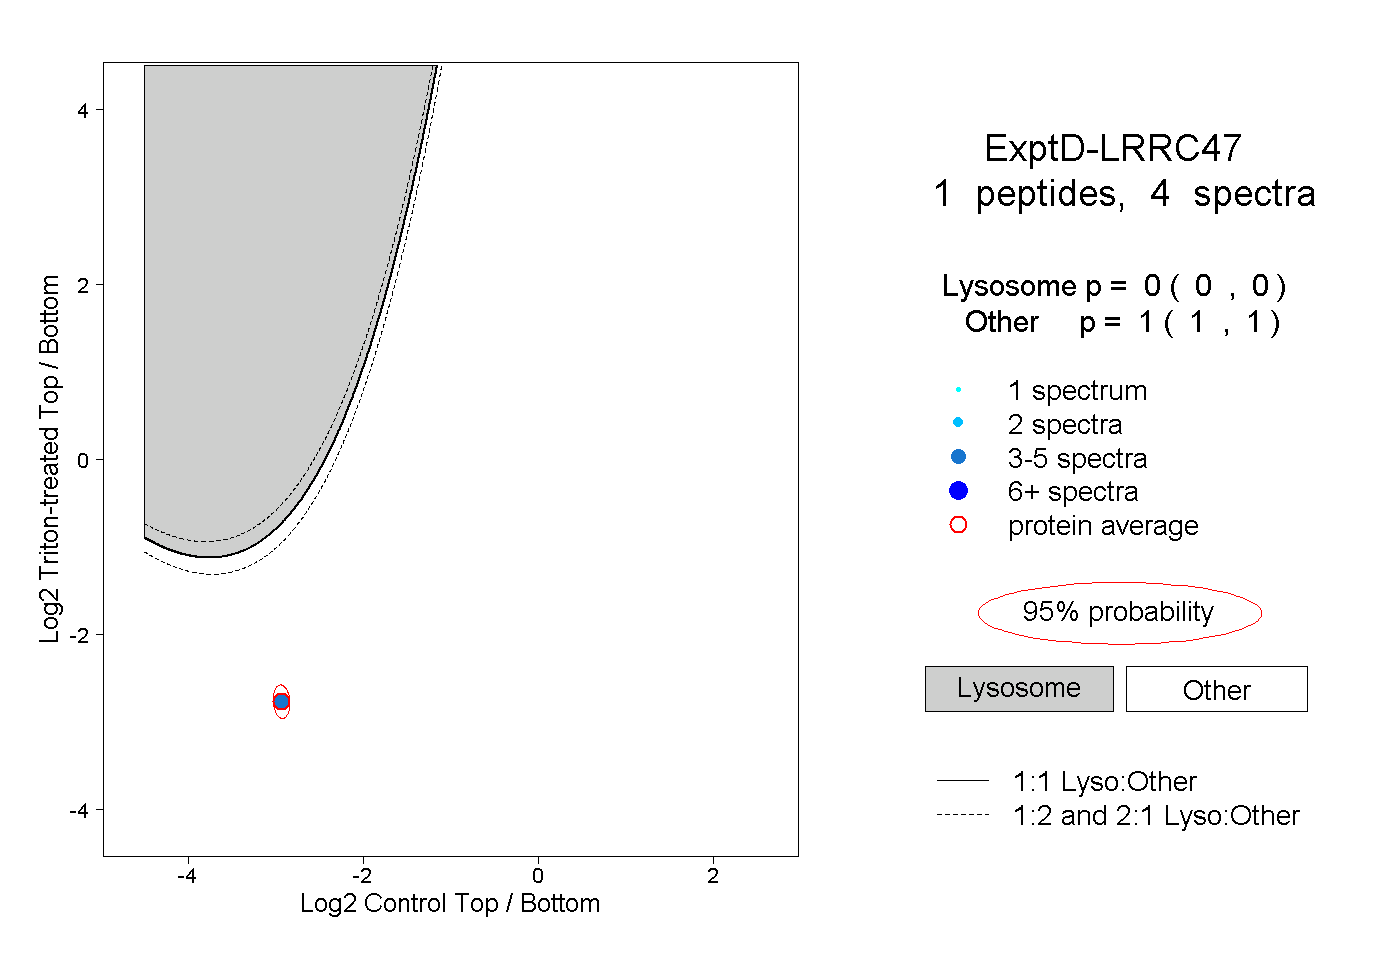
0.000 | 0.000
1.000 | 1.000