 13
13peptides
spectra
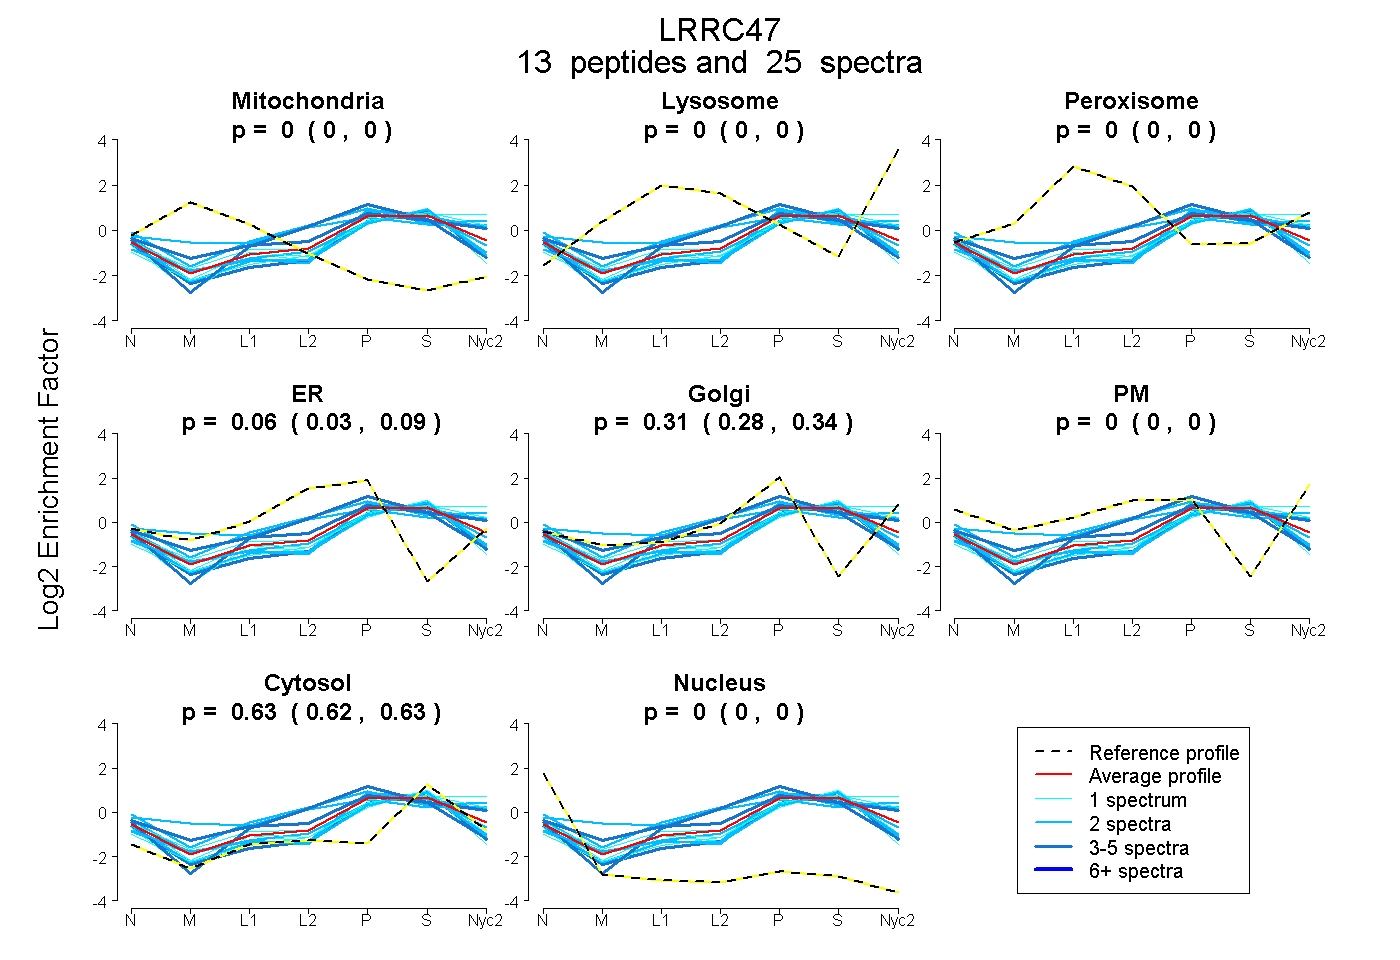
0.000 | 0.000
0.000 | 0.000
0.000 | 0.002
0.027 | 0.086
0.277 | 0.342
0.000 | 0.000
0.620 | 0.635
0.000 | 0.000
| Plot | Mito | Lyso | Perox | ER | Golgi | PM | Cytosol | Nucleus | |||||
| Expt A |
13 peptides |
25 spectra |
|
0.000 0.000 | 0.000 |
0.000 0.000 | 0.000 |
0.000 0.000 | 0.002 |
0.059 0.027 | 0.086 |
0.312 0.277 | 0.342 |
0.000 0.000 | 0.000 |
0.628 0.620 | 0.635 |
0.000 0.000 | 0.000 |
| 2 spectra, DGQCPLVVEQVR | 0.000 | 0.000 | 0.196 | 0.000 | 0.260 | 0.152 | 0.392 | 0.000 | ||
| 3 spectra, VVDLEGSLK | 0.000 | 0.000 | 0.000 | 0.419 | 0.000 | 0.000 | 0.581 | 0.000 | ||
| 3 spectra, TAATIATHDLQAVR | 0.000 | 0.000 | 0.131 | 0.000 | 0.394 | 0.000 | 0.475 | 0.000 | ||
| 2 spectra, ELPADLAR | 0.000 | 0.000 | 0.000 | 0.000 | 0.338 | 0.000 | 0.662 | 0.000 | ||
| 1 spectrum, DIMDSLVLK | 0.000 | 0.000 | 0.000 | 0.006 | 0.205 | 0.000 | 0.787 | 0.002 | ||
| 1 spectrum, FLNSQTK | 0.000 | 0.128 | 0.000 | 0.000 | 0.312 | 0.000 | 0.560 | 0.000 | ||
| 2 spectra, ELLLTGPGLEER | 0.000 | 0.000 | 0.000 | 0.123 | 0.179 | 0.000 | 0.683 | 0.015 | ||
| 1 spectrum, MVGGCQTK | 0.000 | 0.000 | 0.000 | 0.108 | 0.098 | 0.000 | 0.780 | 0.014 | ||
| 1 spectrum, GMDLQPGNALR | 0.000 | 0.000 | 0.000 | 0.000 | 0.289 | 0.064 | 0.648 | 0.000 | ||
| 2 spectra, IVPLGR | 0.000 | 0.000 | 0.094 | 0.040 | 0.219 | 0.226 | 0.421 | 0.000 | ||
| 2 spectra, DVRPYIVGAVVR | 0.000 | 0.000 | 0.000 | 0.000 | 0.405 | 0.000 | 0.595 | 0.000 | ||
| 3 spectra, APGPGLAQGLPQLHSLVLR | 0.000 | 0.000 | 0.000 | 0.000 | 0.228 | 0.000 | 0.727 | 0.044 | ||
| 2 spectra, YLHLLDGK | 0.000 | 0.000 | 0.000 | 0.005 | 0.247 | 0.000 | 0.744 | 0.004 |
| Plot | Mito | Lyso or Perox | ER | Golgi | PM | Cytosol | Nucleus | ||||||
| Expt B |
5 peptides |
7 spectra |
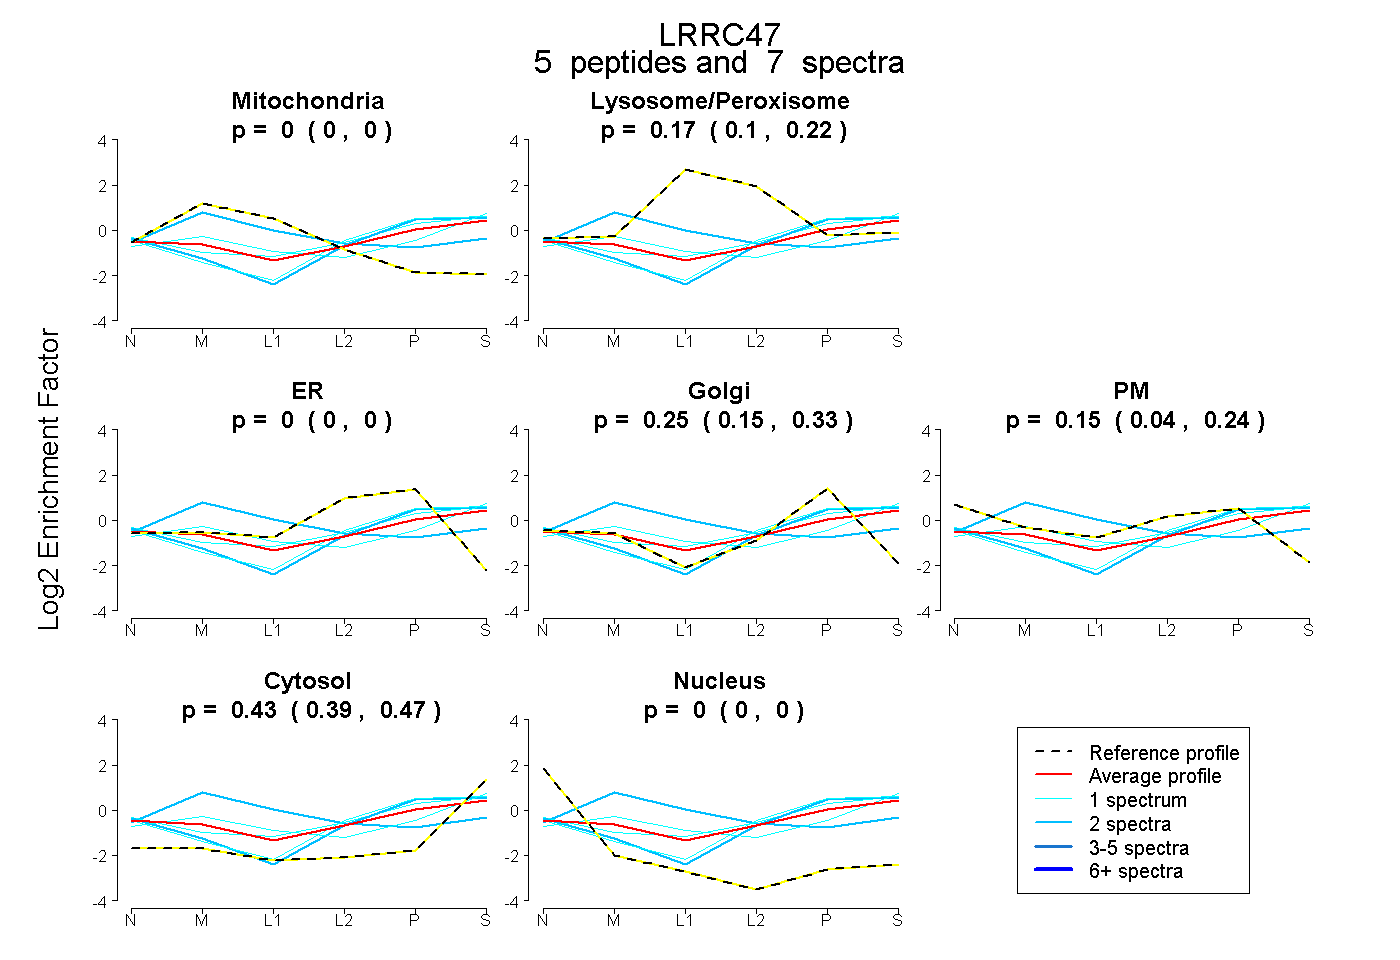 |
0.000 0.000 | 0.000 |
0.167 0.105 | 0.220 |
0.000 0.000 | 0.000 |
0.250 0.153 | 0.334 |
0.151 0.043 | 0.242 |
0.432 0.391 | 0.467 |
0.000 0.000 | 0.000 |
|||
| Plot | Lyso | Other | |||||||||||
| Expt C |
10 peptides |
23 spectra |
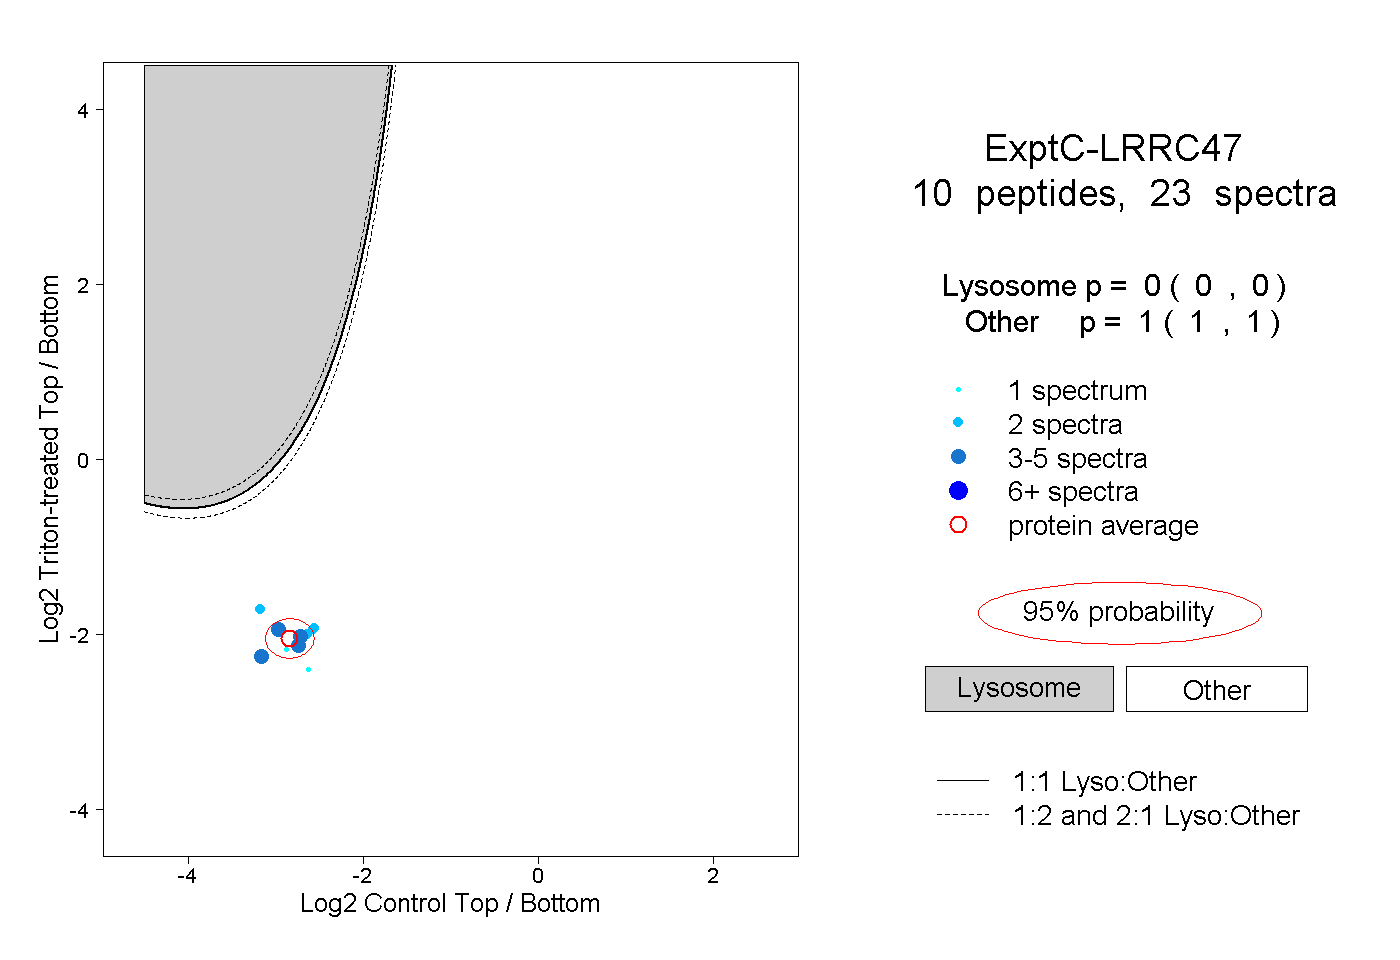 |
0.000 0.000 | 0.000 |
1.000 1.000 | 1.000 |
||||||||
| Plot | Lyso | Other | |||||||||||
| Expt D |
1 peptide |
4 spectra |
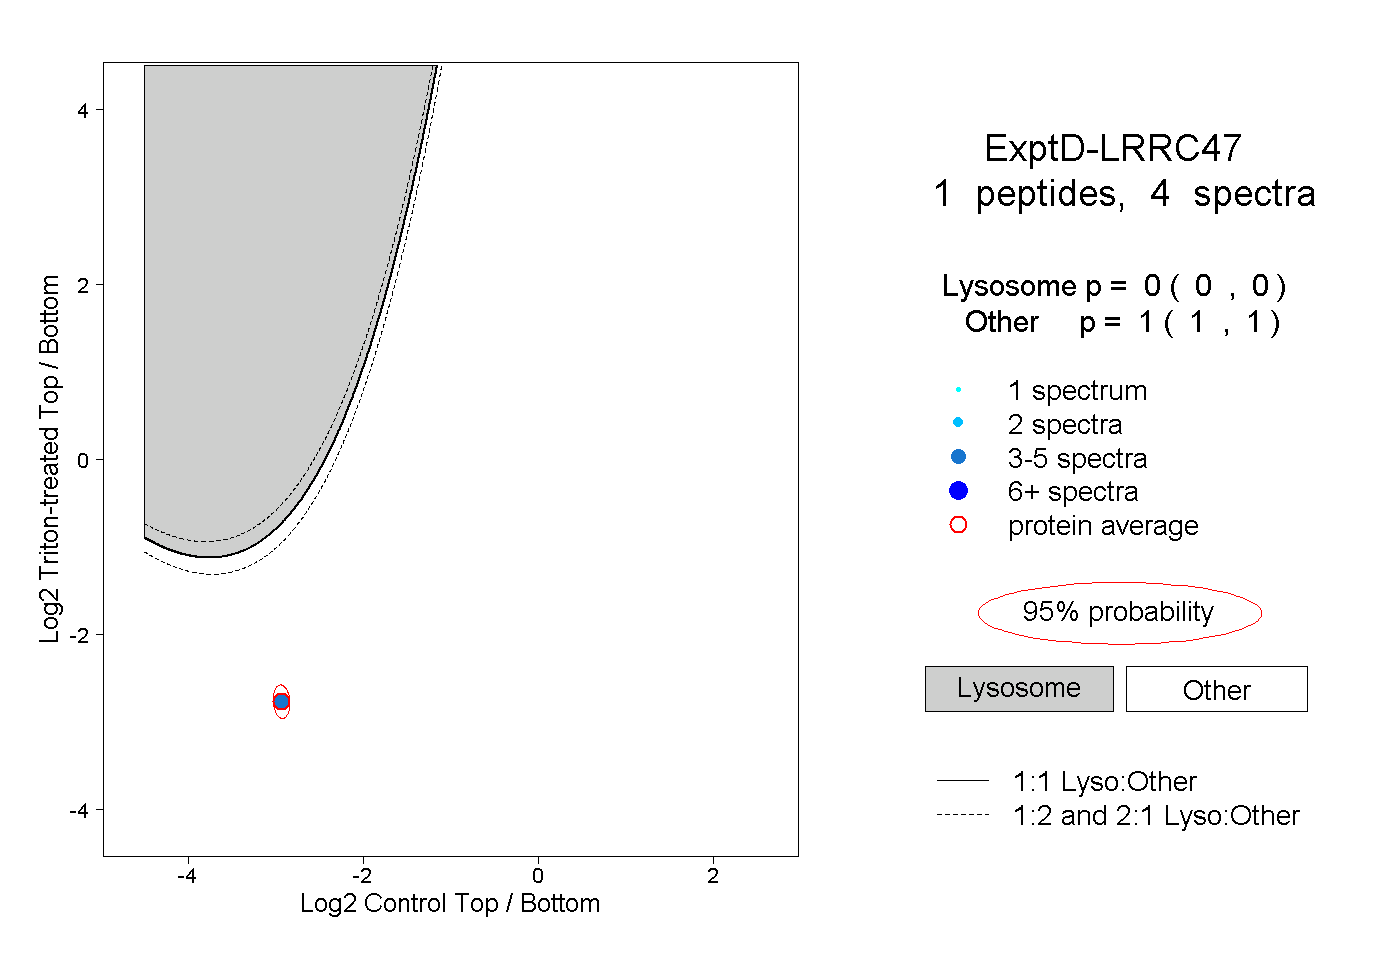 |
0.000 0.000 | 0.000 |
1.000 1.000 | 1.000 |