 3
3peptides
spectra
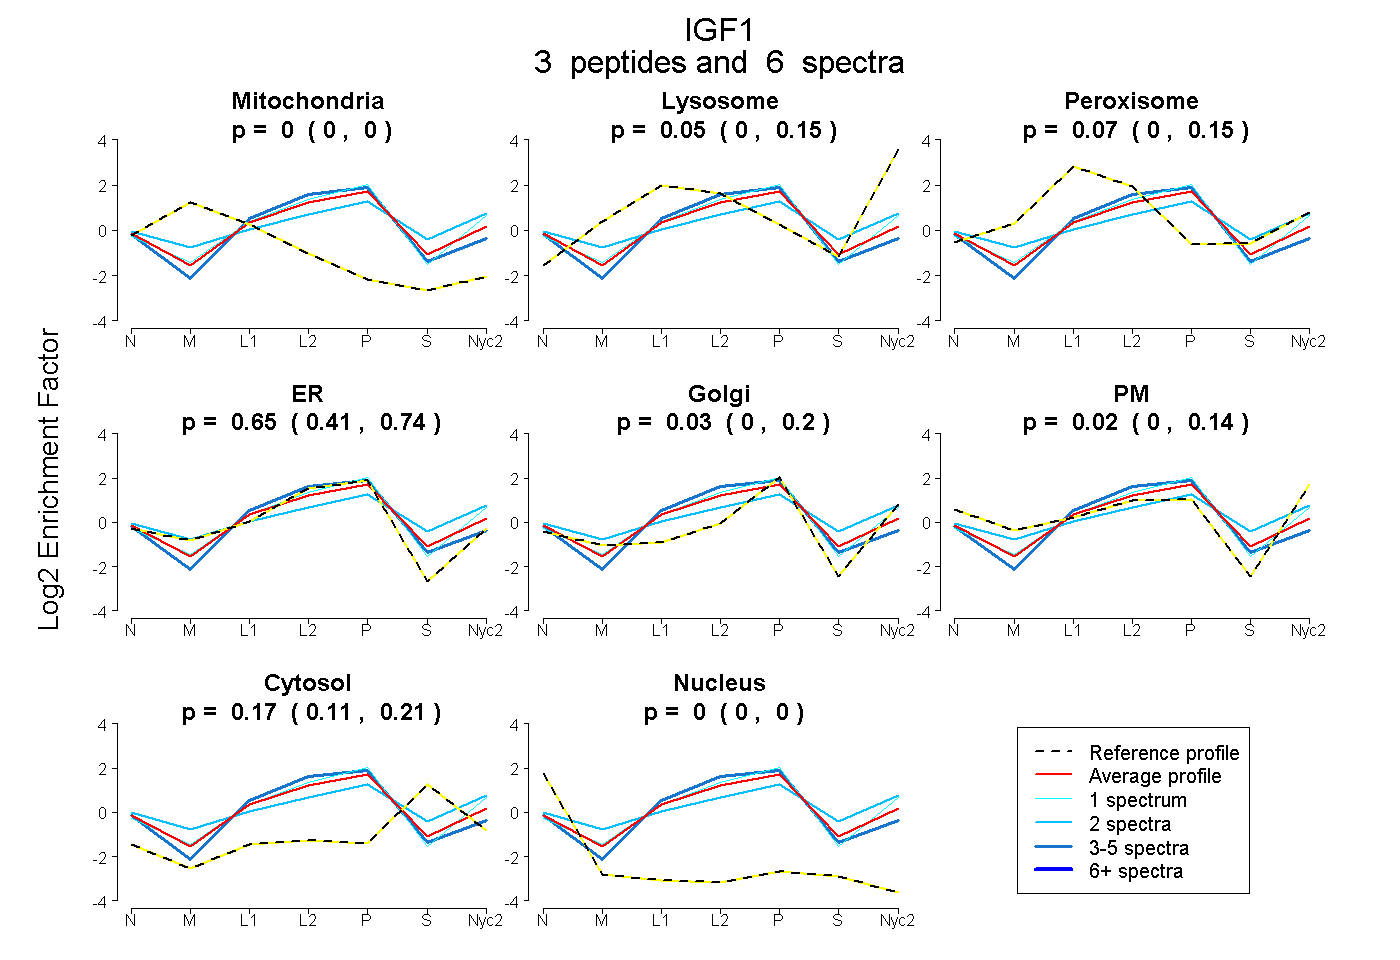
0.000 | 0.000
0.000 | 0.150
0.000 | 0.154
0.412 | 0.742
0.000 | 0.196
0.000 | 0.137
0.110 | 0.211
0.000 | 0.000
4peptides
spectra
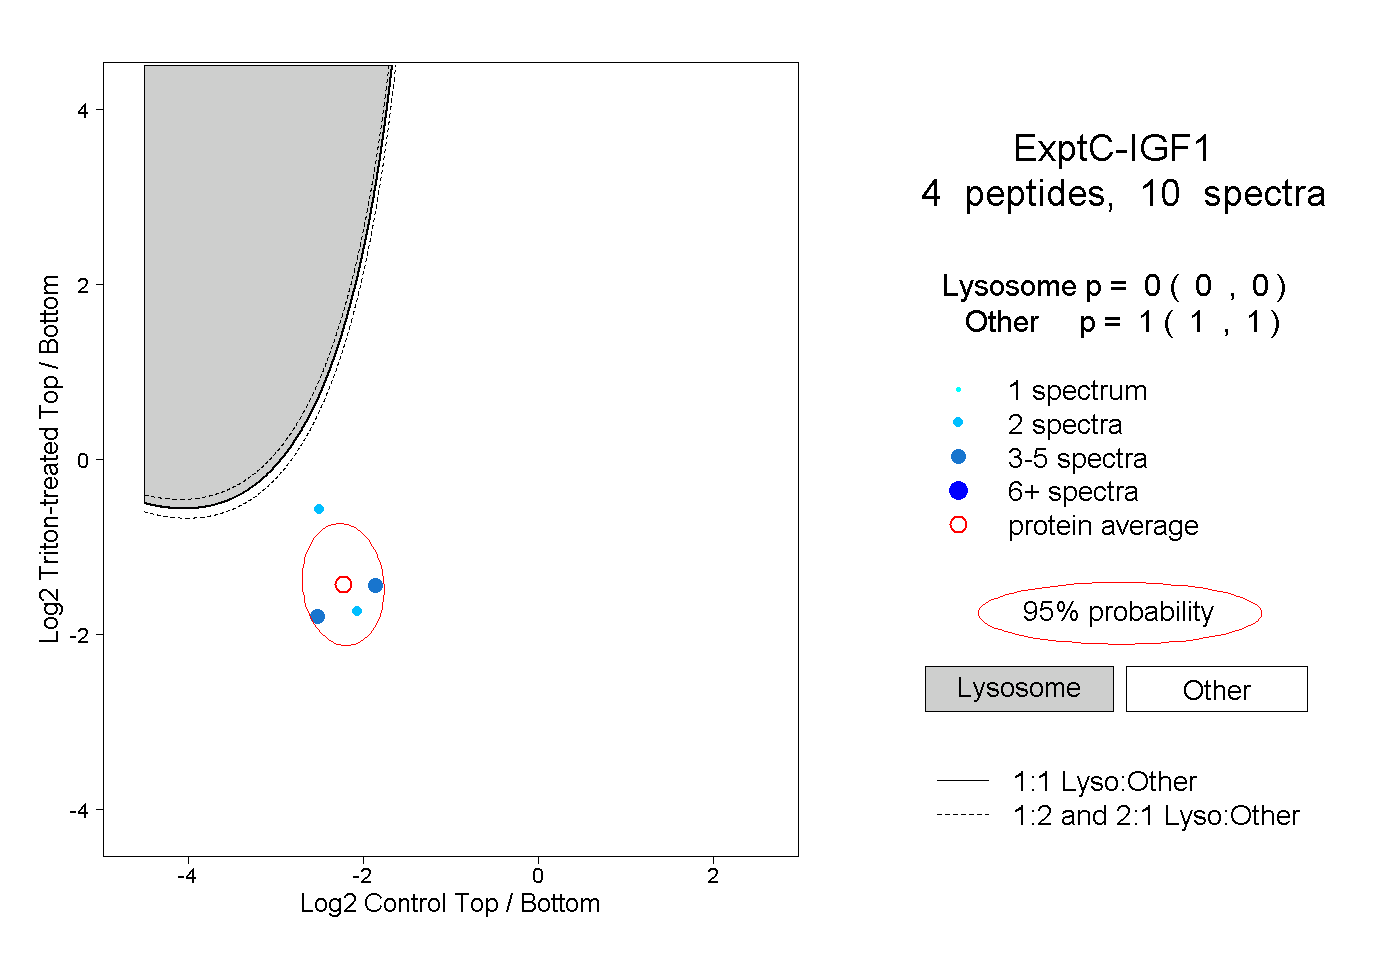
0.000 | 0.000
1.000 | 1.000
1peptide
spectrum
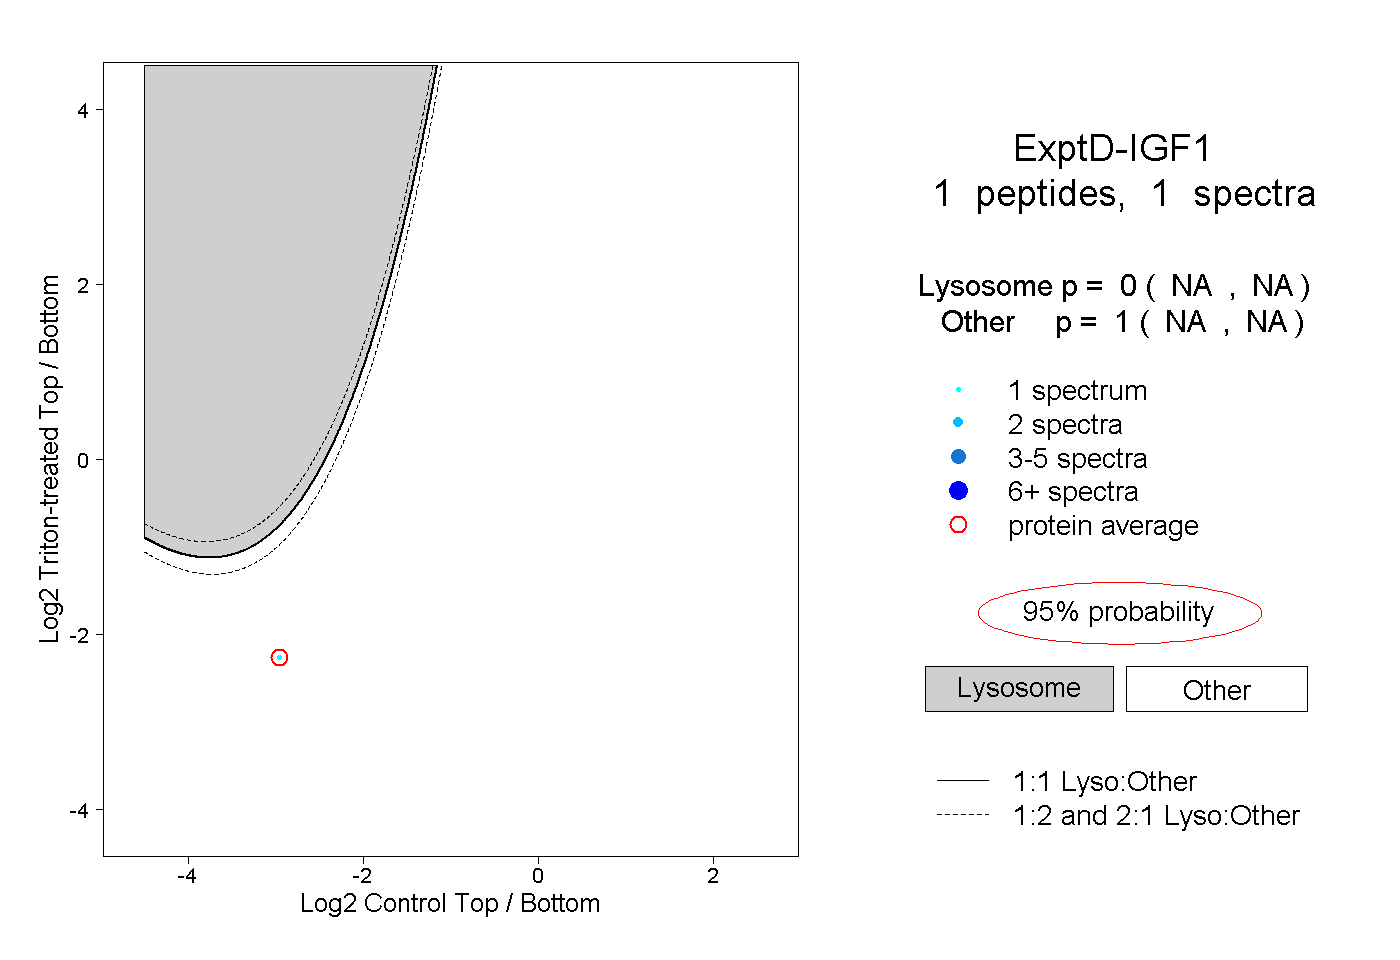
NA | NA
NA | NA