 3
3peptides
spectra
0.000 | 0.000
0.000 | 0.150
0.000 | 0.154
0.412 | 0.742
0.000 | 0.196
0.000 | 0.137
0.110 | 0.211
0.000 | 0.000
| Plot | Mito | Lyso | Perox | ER | Golgi | PM | Cytosol | Nucleus | |||||
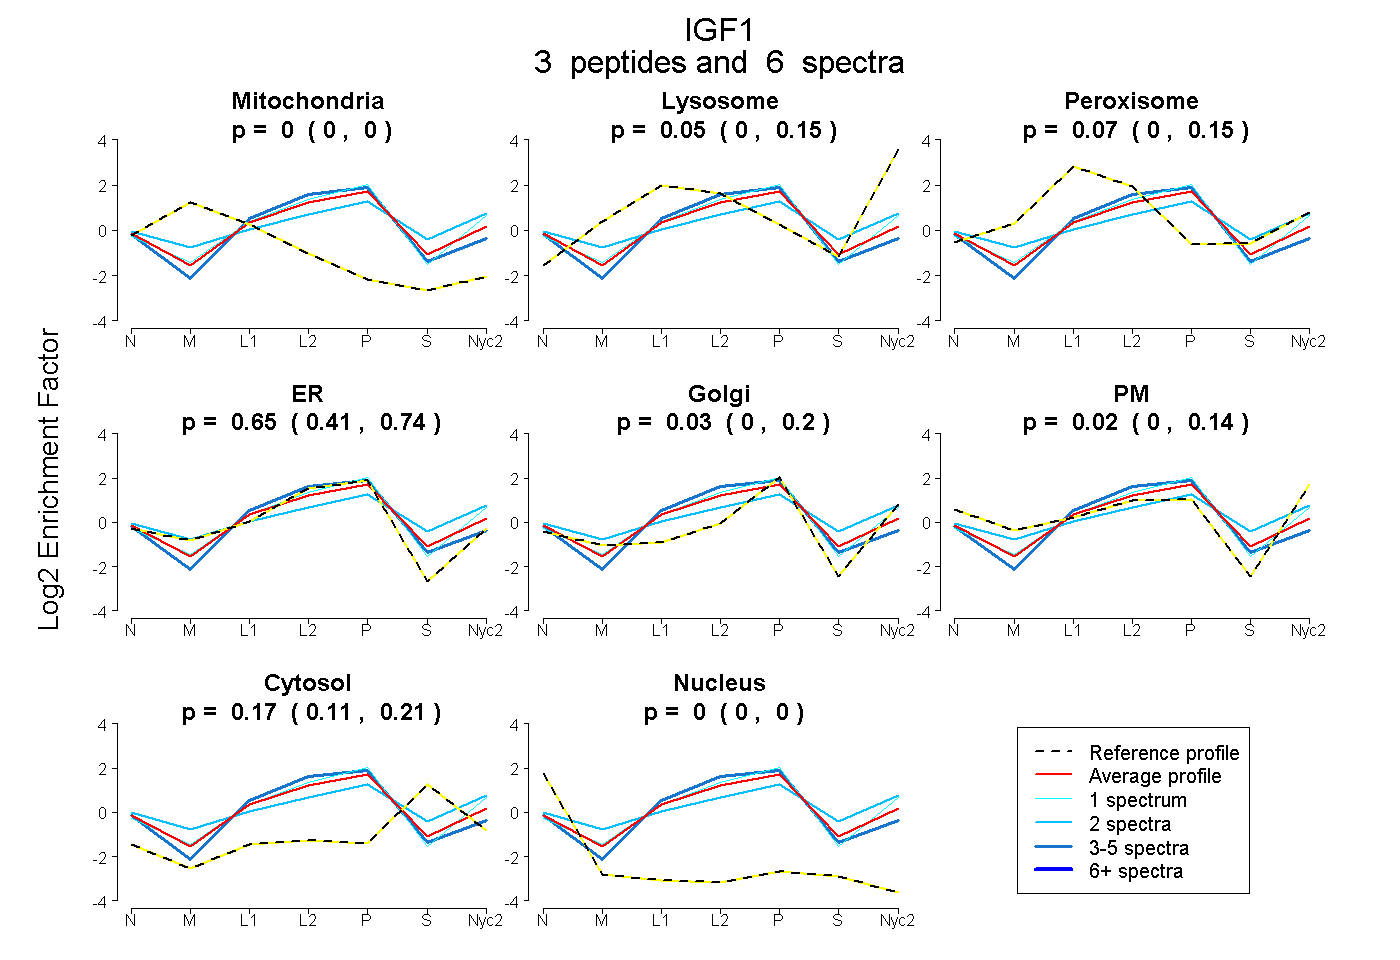
| Expt A |
3 peptides |
6 spectra |
|
0.000 0.000 | 0.000 |
0.050 0.000 | 0.150 |
0.074 0.000 | 0.154 |
0.650 0.412 | 0.742 |
0.031 0.000 | 0.196 |
0.024 0.000 | 0.137 |
0.170 0.110 | 0.211 |
0.000 0.000 | 0.000 |
| 1 spectrum, HTDMPK | 0.000 | 0.162 | 0.000 | 0.629 | 0.137 | 0.000 | 0.072 | 0.000 | ||
| 3 spectra, GFYFNKPTGYGSSIR | 0.000 | 0.000 | 0.058 | 0.799 | 0.000 | 0.000 | 0.143 | 0.000 | ||
| 2 spectra, APQTGIVDECCFR | 0.000 | 0.000 | 0.254 | 0.005 | 0.384 | 0.177 | 0.181 | 0.000 |
| Plot | Lyso | Other | |||||||||||
| Expt C |
4 peptides |
10 spectra |
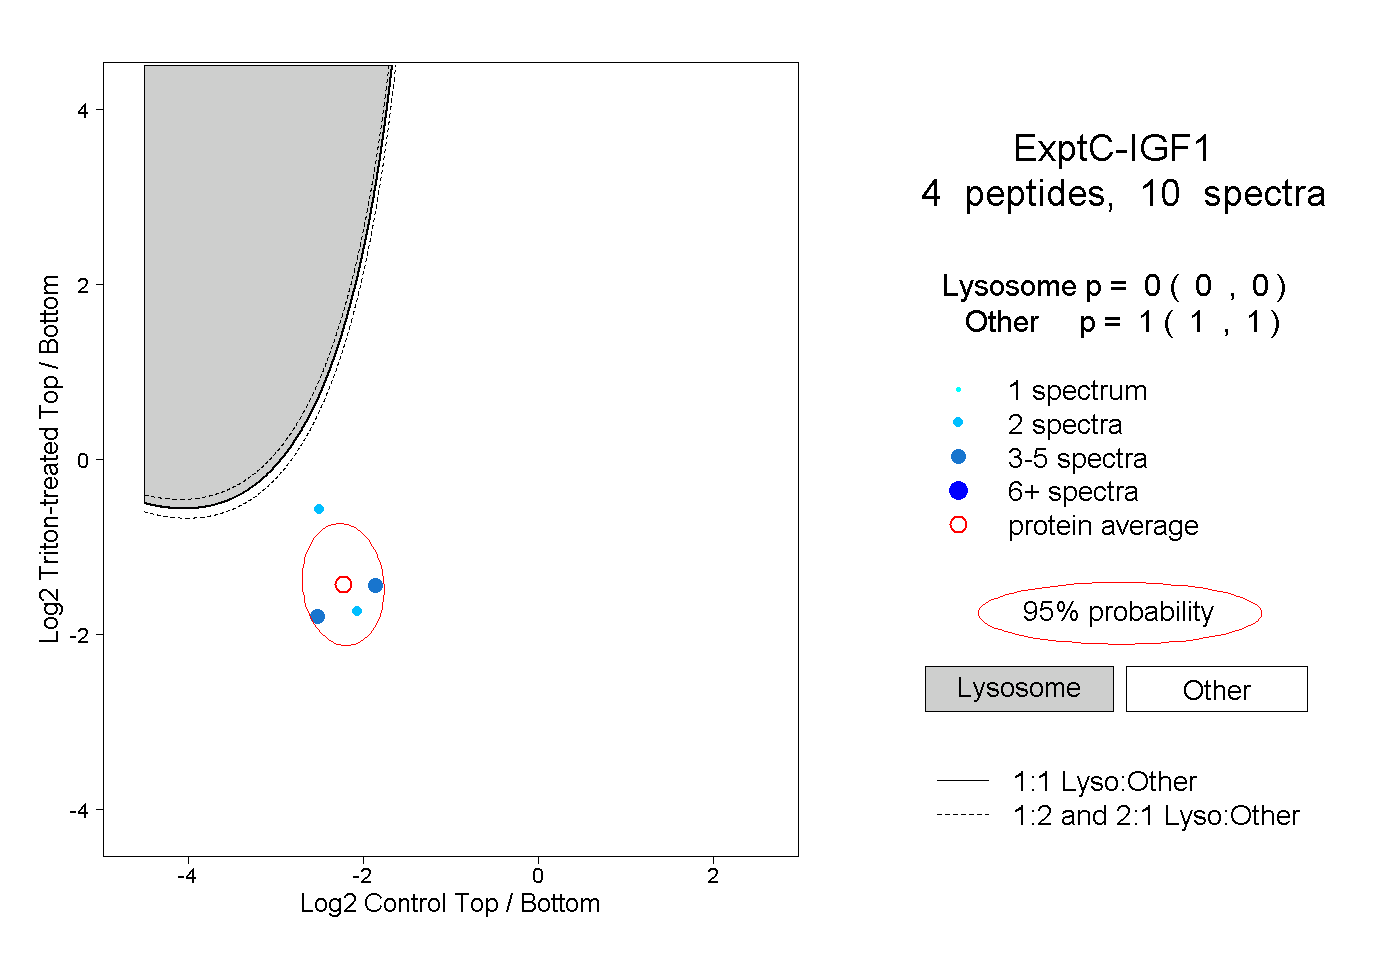 |
0.000 0.000 | 0.000 |
1.000 1.000 | 1.000 |
||||||||
| Plot | Lyso | Other | |||||||||||
| Expt D |
1 peptide |
1 spectrum |
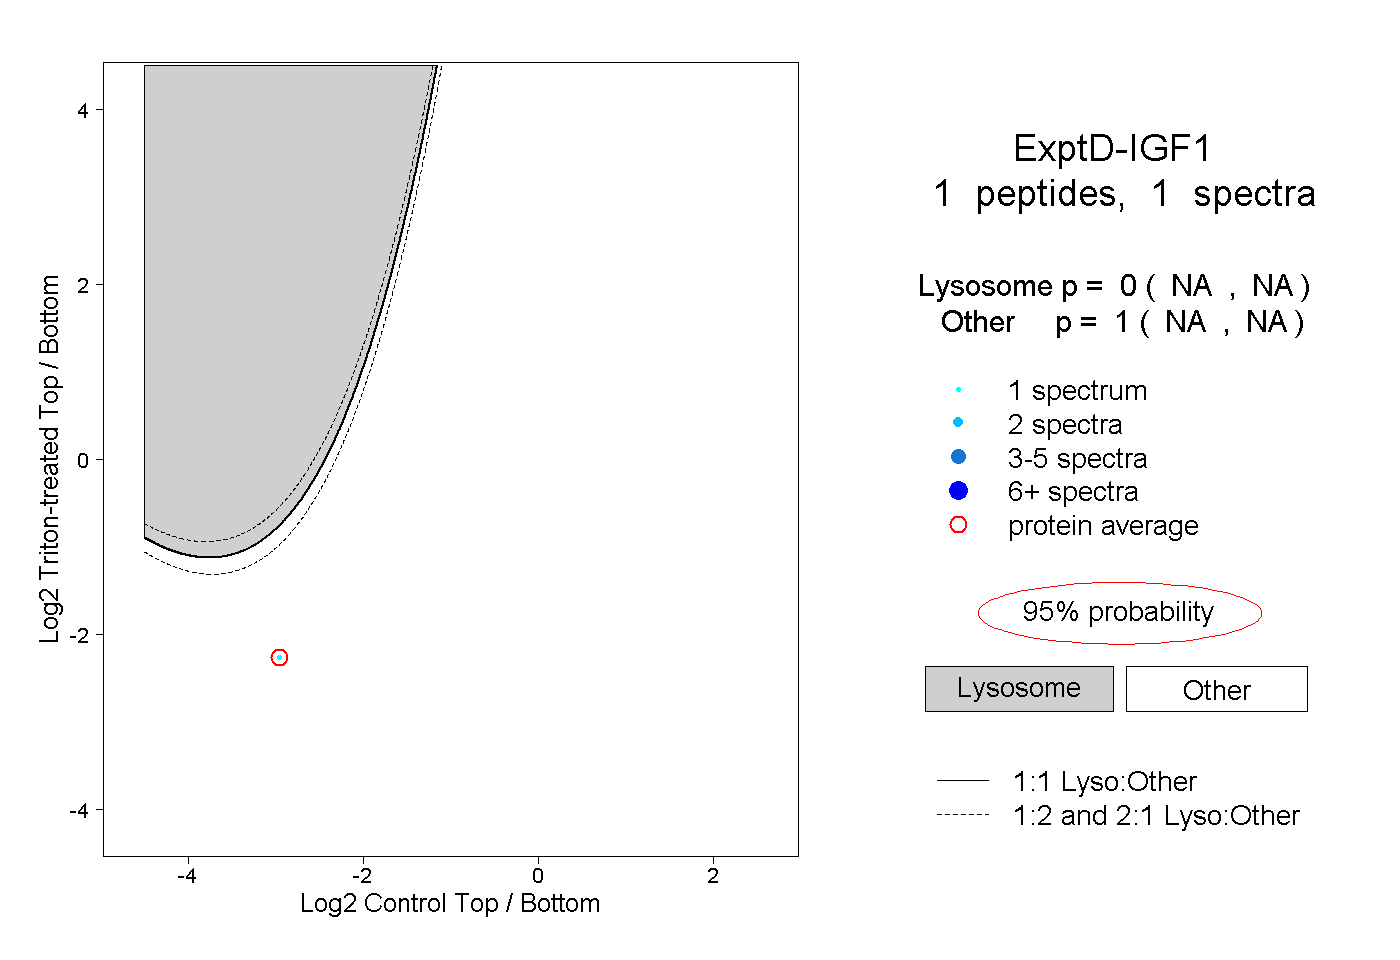 |
0.000 NA | NA |
1.000 NA | NA |