 5
5peptides
spectra
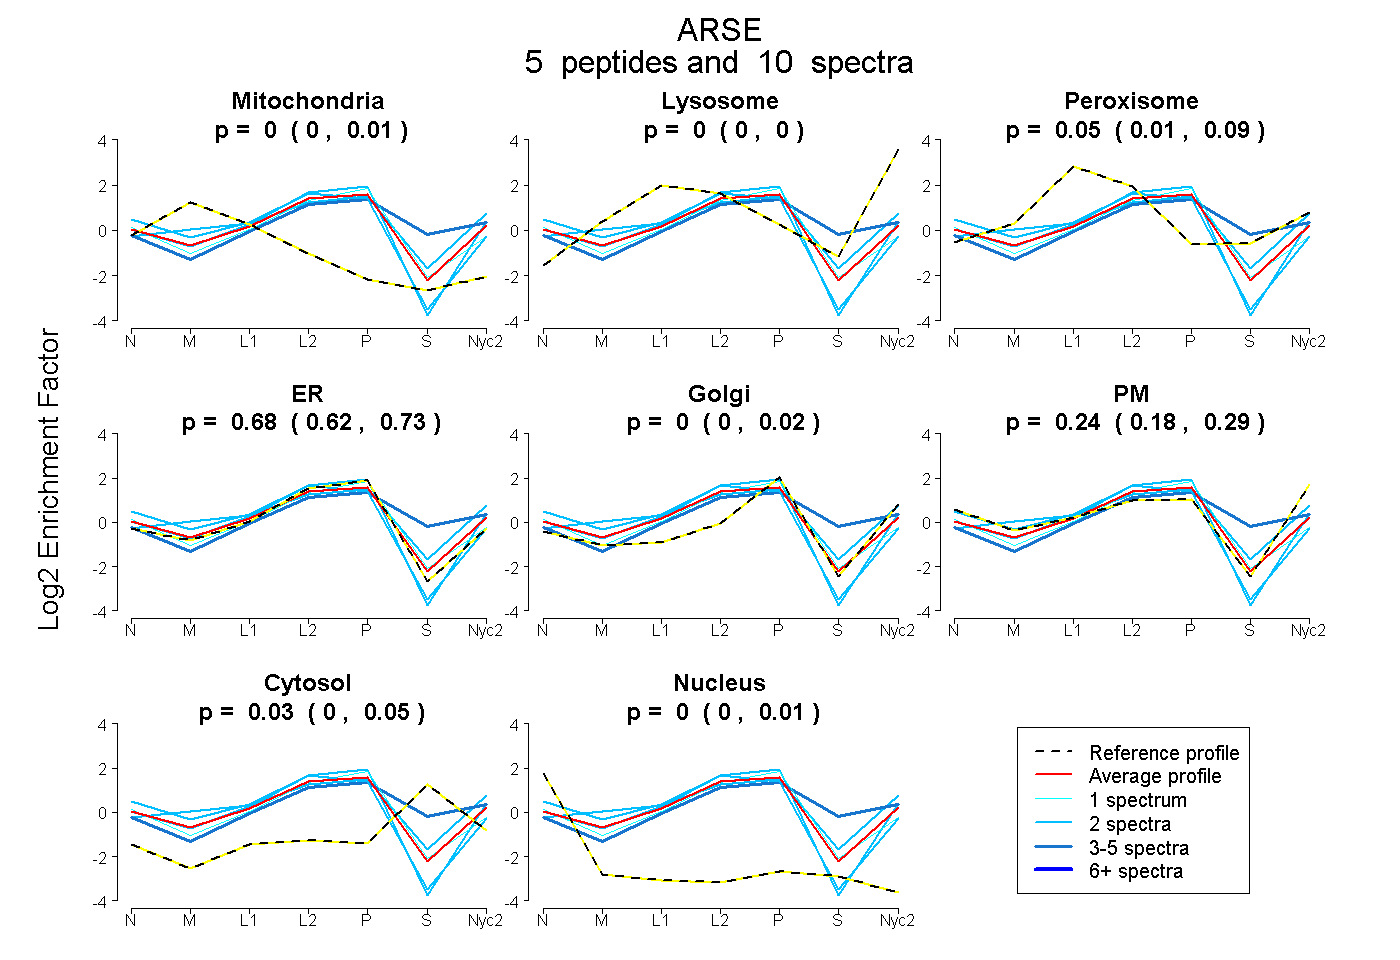
0.000 | 0.006
0.000 | 0.000
0.010 | 0.087
0.618 | 0.726
0.000 | 0.017
0.180 | 0.288
0.000 | 0.051
0.000 | 0.013
2peptides
spectra
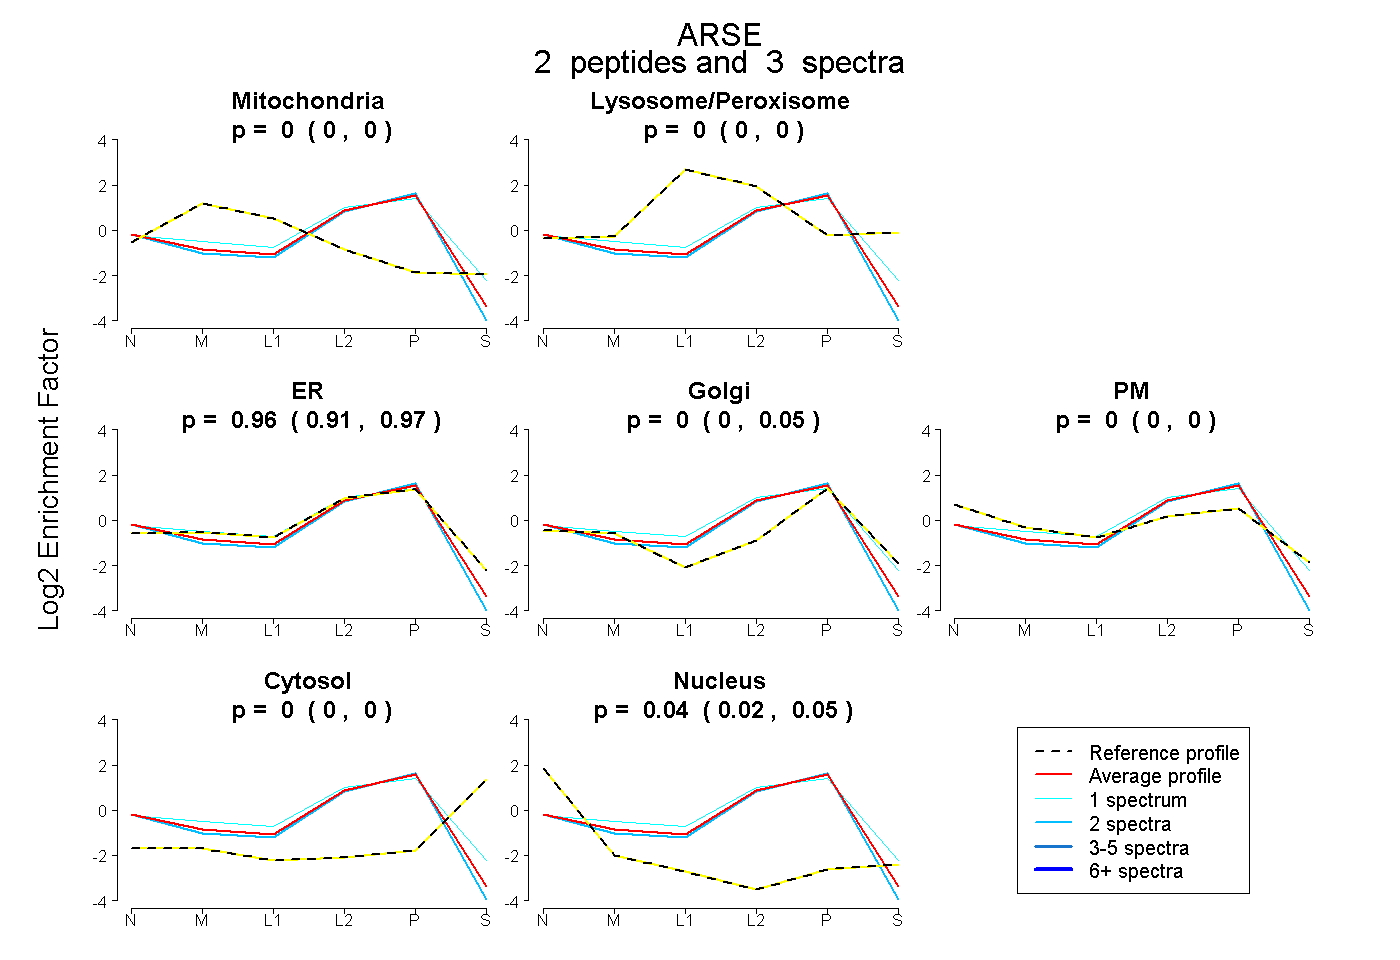
0.000 | 0.000
0.000 | 0.000
0.907 | 0.975
0.000 | 0.050
0.000 | 0.000
0.000 | 0.000
0.016 | 0.049
6peptides
spectra
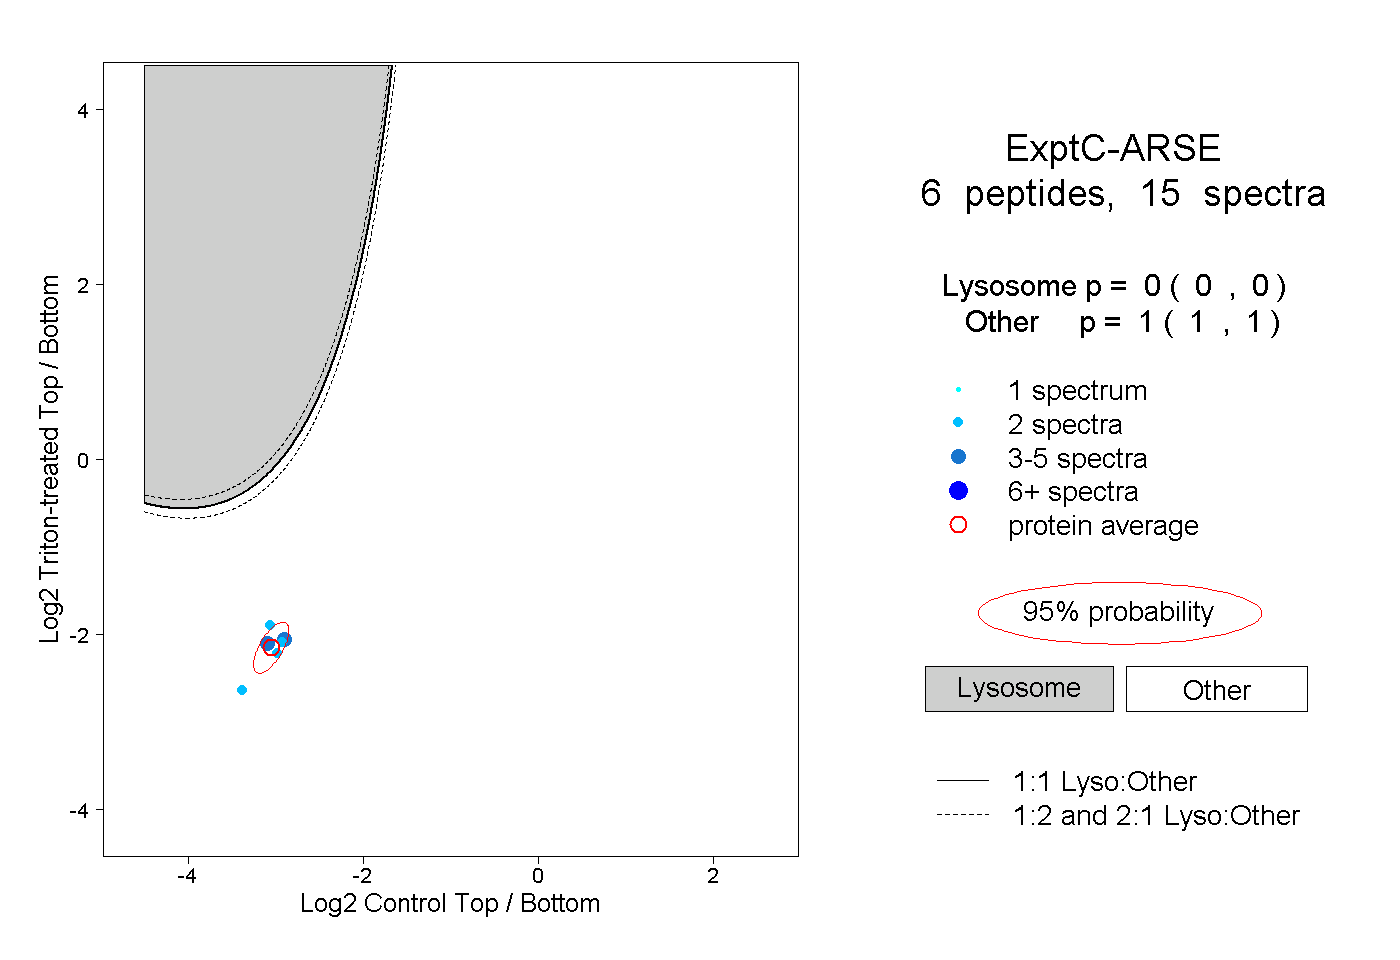
0.000 | 0.000
1.000 | 1.000
1peptide
spectrum
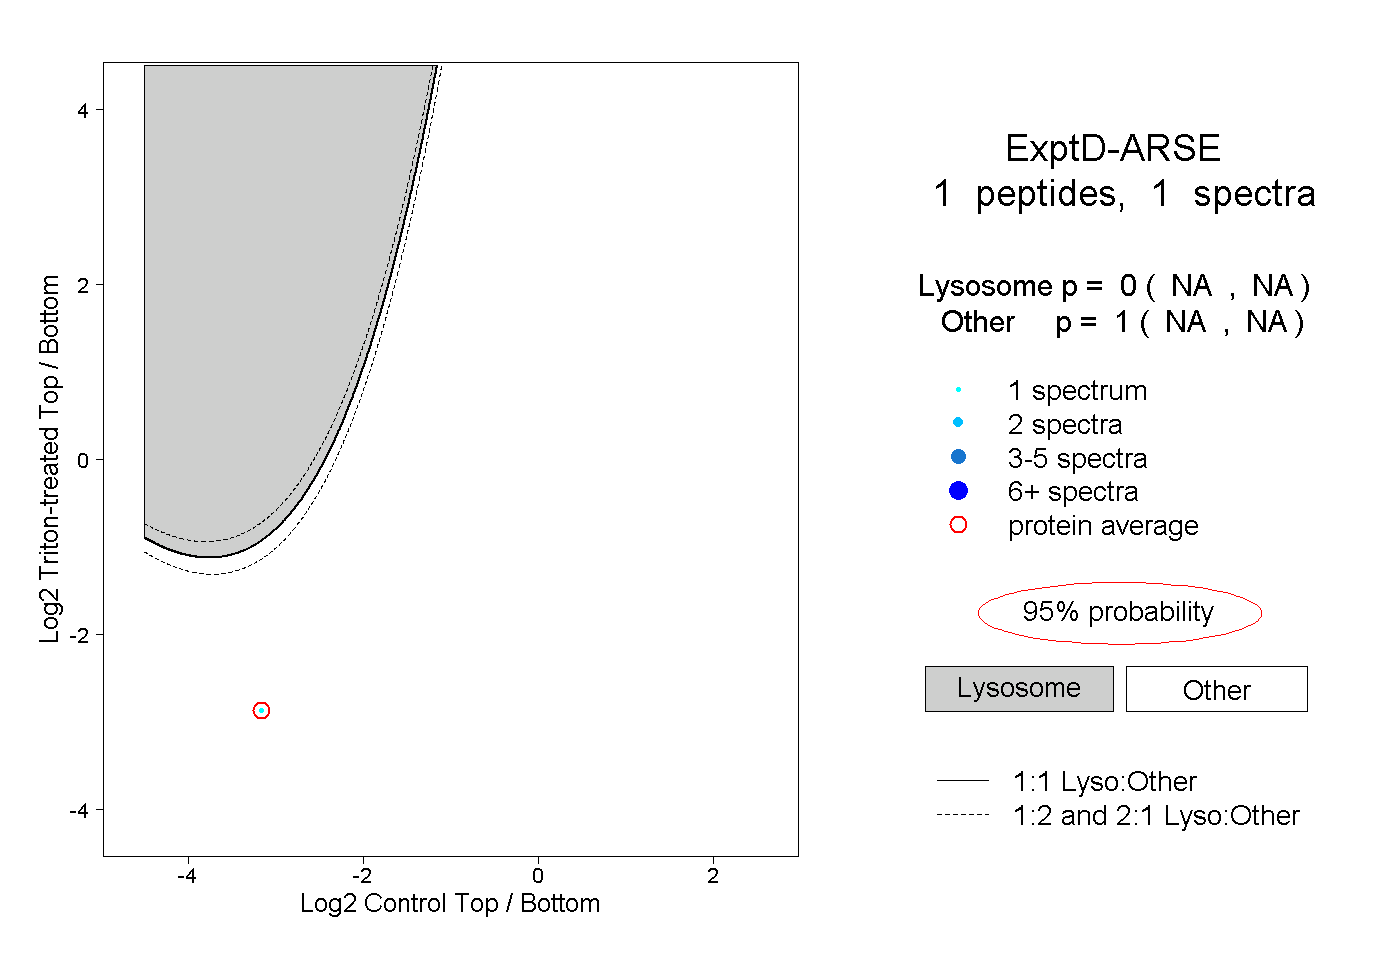
NA | NA
NA | NA