 5
5peptides
spectra
0.000 | 0.006
0.000 | 0.000
0.010 | 0.087
0.618 | 0.726
0.000 | 0.017
0.180 | 0.288
0.000 | 0.051
0.000 | 0.013
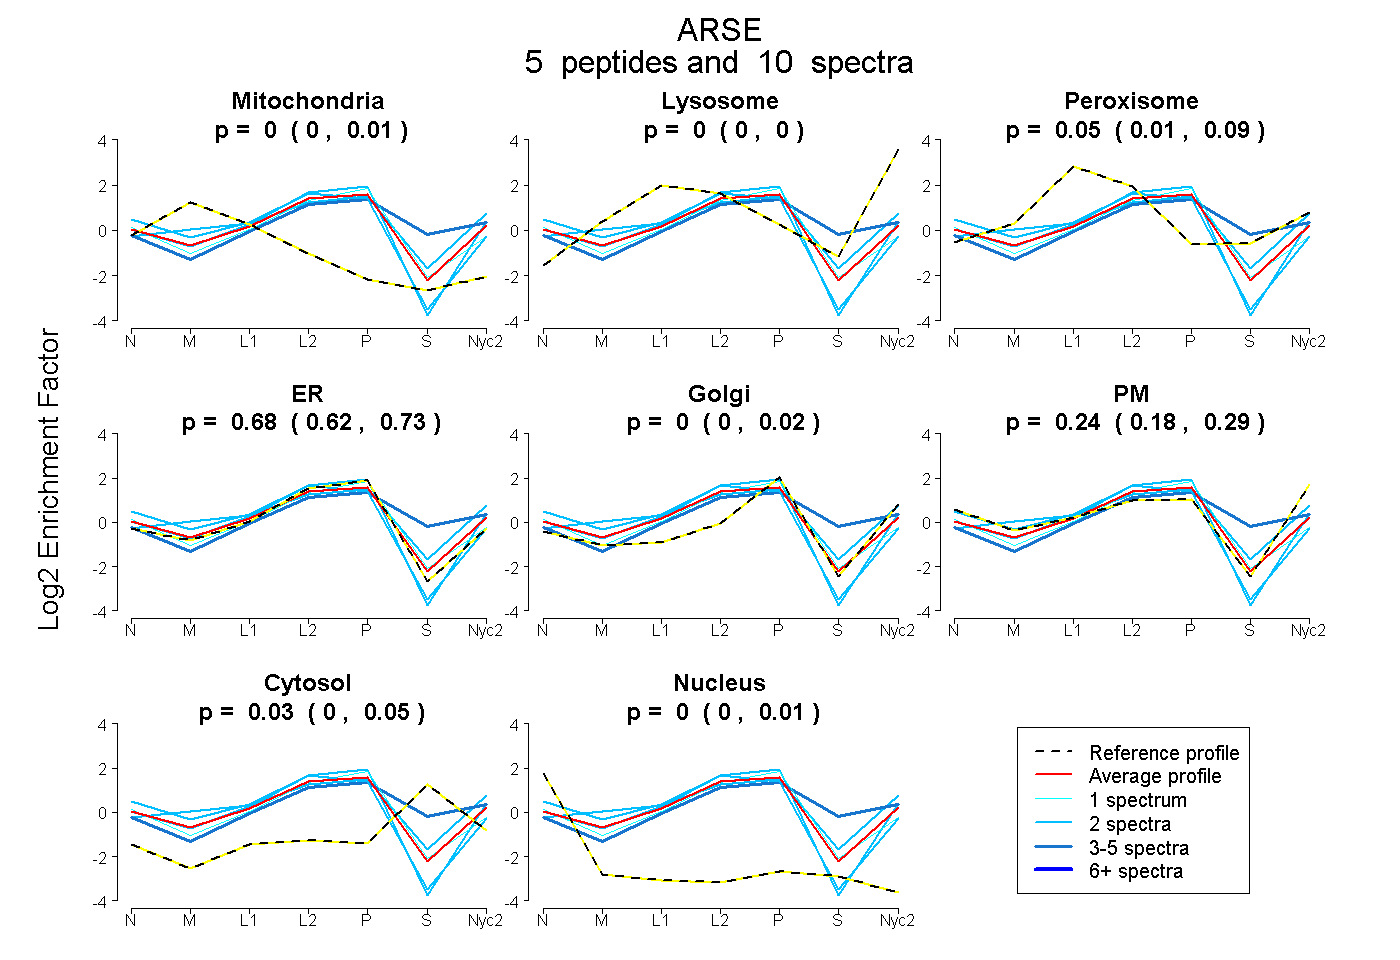
| Plot | Mito | Lyso | Perox | ER | Golgi | PM | Cytosol | Nucleus | |||||
| Expt A |
5 peptides |
10 spectra |
|
0.000 0.000 | 0.006 |
0.000 0.000 | 0.000 |
0.053 0.010 | 0.087 |
0.682 0.618 | 0.726 |
0.000 0.000 | 0.017 |
0.240 0.180 | 0.288 |
0.026 0.000 | 0.051 |
0.000 0.000 | 0.013 |
| 3 spectra, LAEDGVR | 0.000 | 0.117 | 0.052 | 0.491 | 0.000 | 0.047 | 0.294 | 0.000 | ||
| 2 spectra, GMGGWEGGIR | 0.000 | 0.097 | 0.181 | 0.345 | 0.246 | 0.131 | 0.000 | 0.000 | ||
| 1 spectrum, VLDQPVSLMDVFPTVVR | 0.000 | 0.000 | 0.000 | 0.854 | 0.000 | 0.079 | 0.064 | 0.002 | ||
| 2 spectra, WHLGLSCR | 0.086 | 0.000 | 0.000 | 0.760 | 0.000 | 0.154 | 0.000 | 0.000 | ||
| 2 spectra, DLLPLLR | 0.000 | 0.000 | 0.000 | 0.771 | 0.000 | 0.229 | 0.000 | 0.000 |
| Plot | Mito | Lyso or Perox | ER | Golgi | PM | Cytosol | Nucleus | ||||||
| Expt B |
2 peptides |
3 spectra |
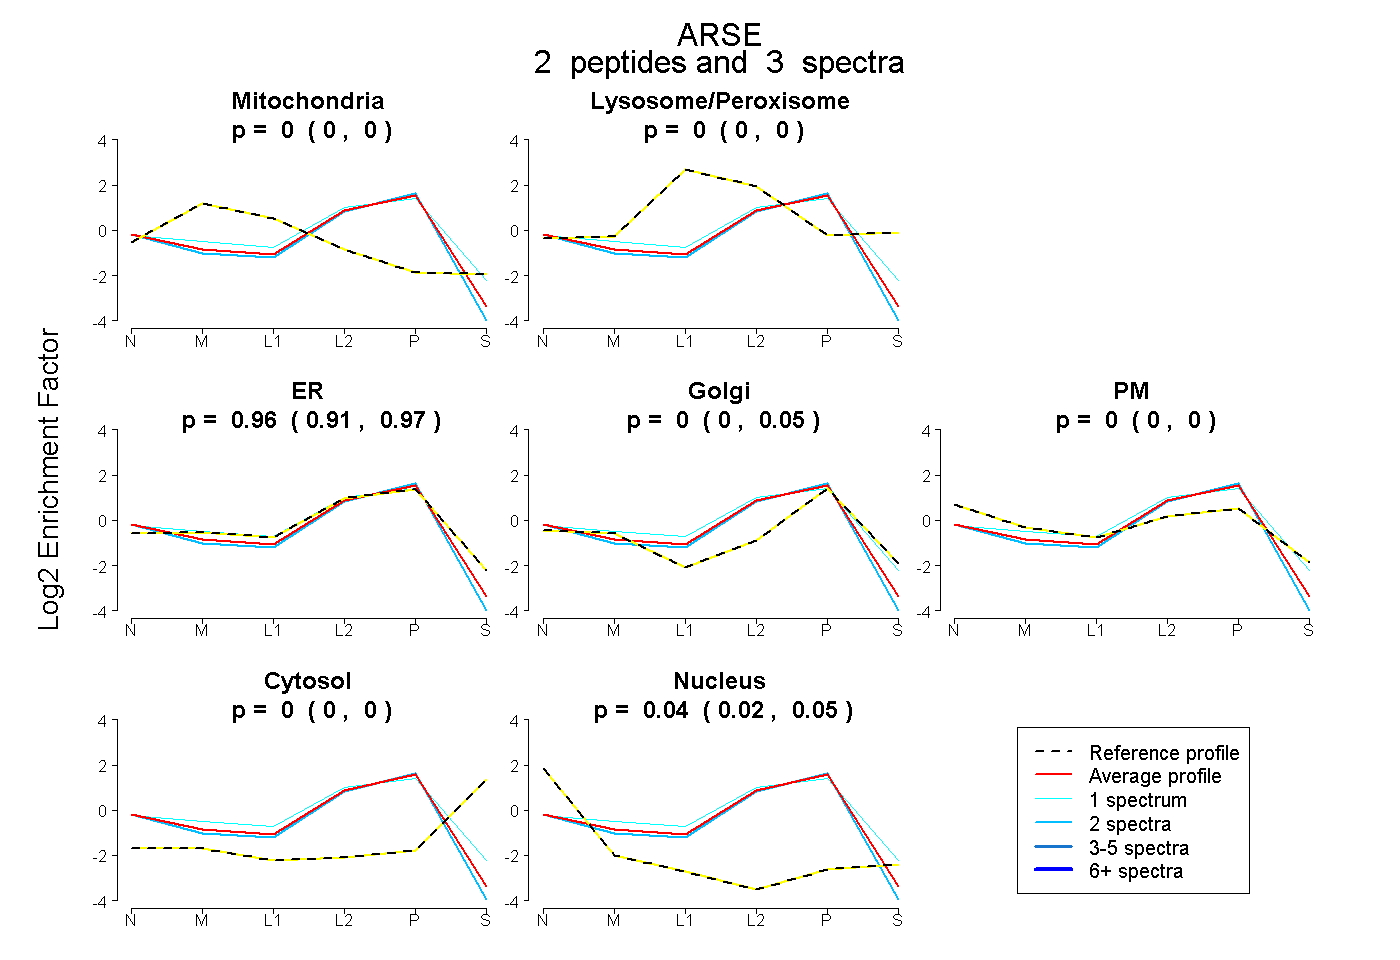 |
0.000 0.000 | 0.000 |
0.000 0.000 | 0.000 |
0.963 0.907 | 0.975 |
0.000 0.000 | 0.050 |
0.000 0.000 | 0.000 |
0.000 0.000 | 0.000 |
0.037 0.016 | 0.049 |
|||
| Plot | Lyso | Other | |||||||||||
| Expt C |
6 peptides |
15 spectra |
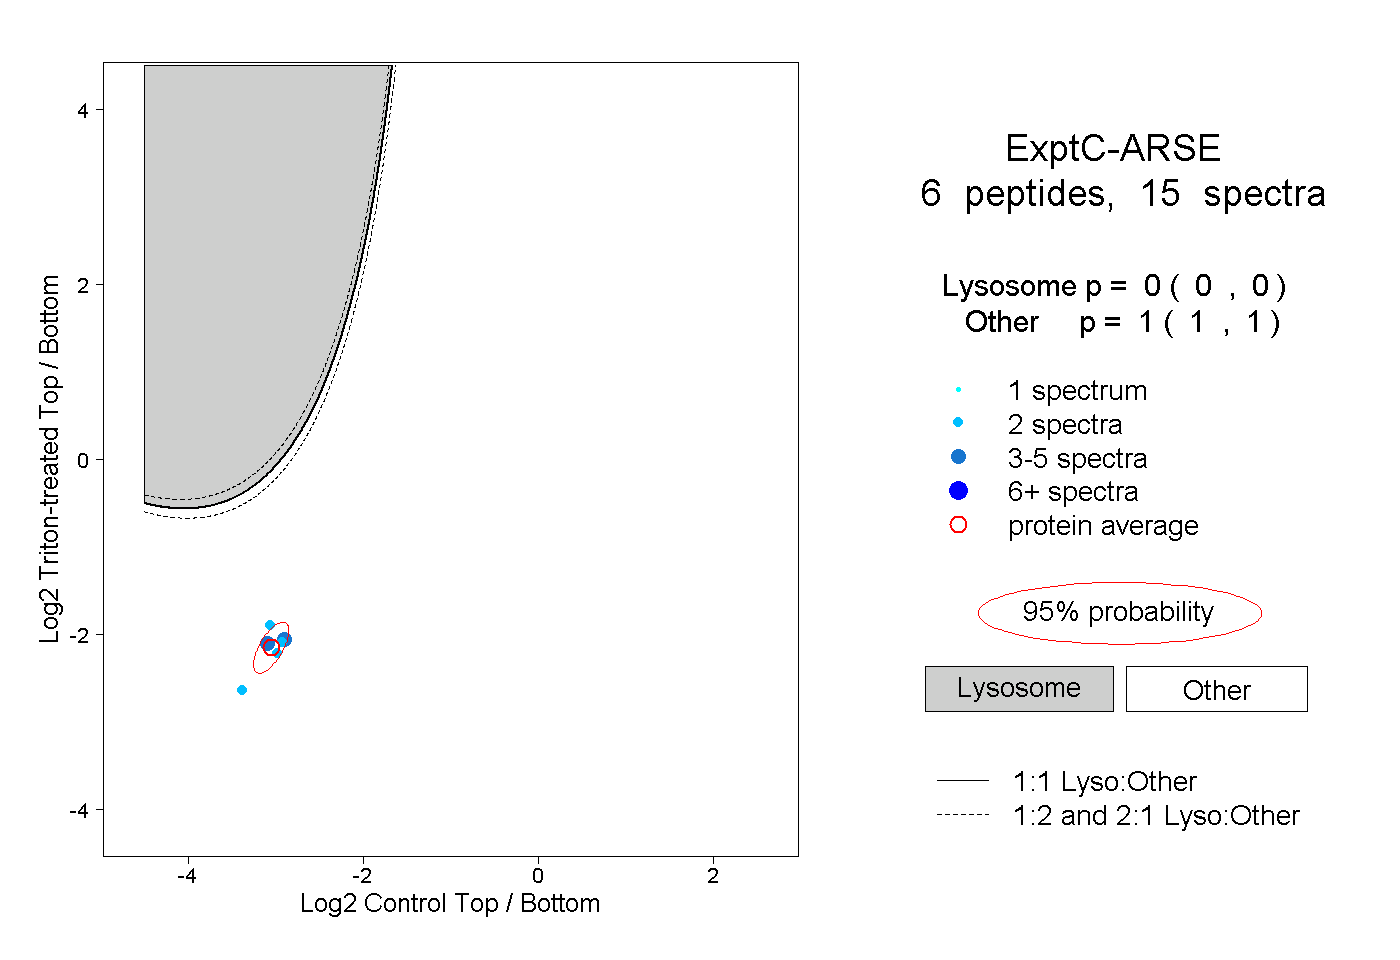 |
0.000 0.000 | 0.000 |
1.000 1.000 | 1.000 |
||||||||
| Plot | Lyso | Other | |||||||||||
| Expt D |
1 peptide |
1 spectrum |
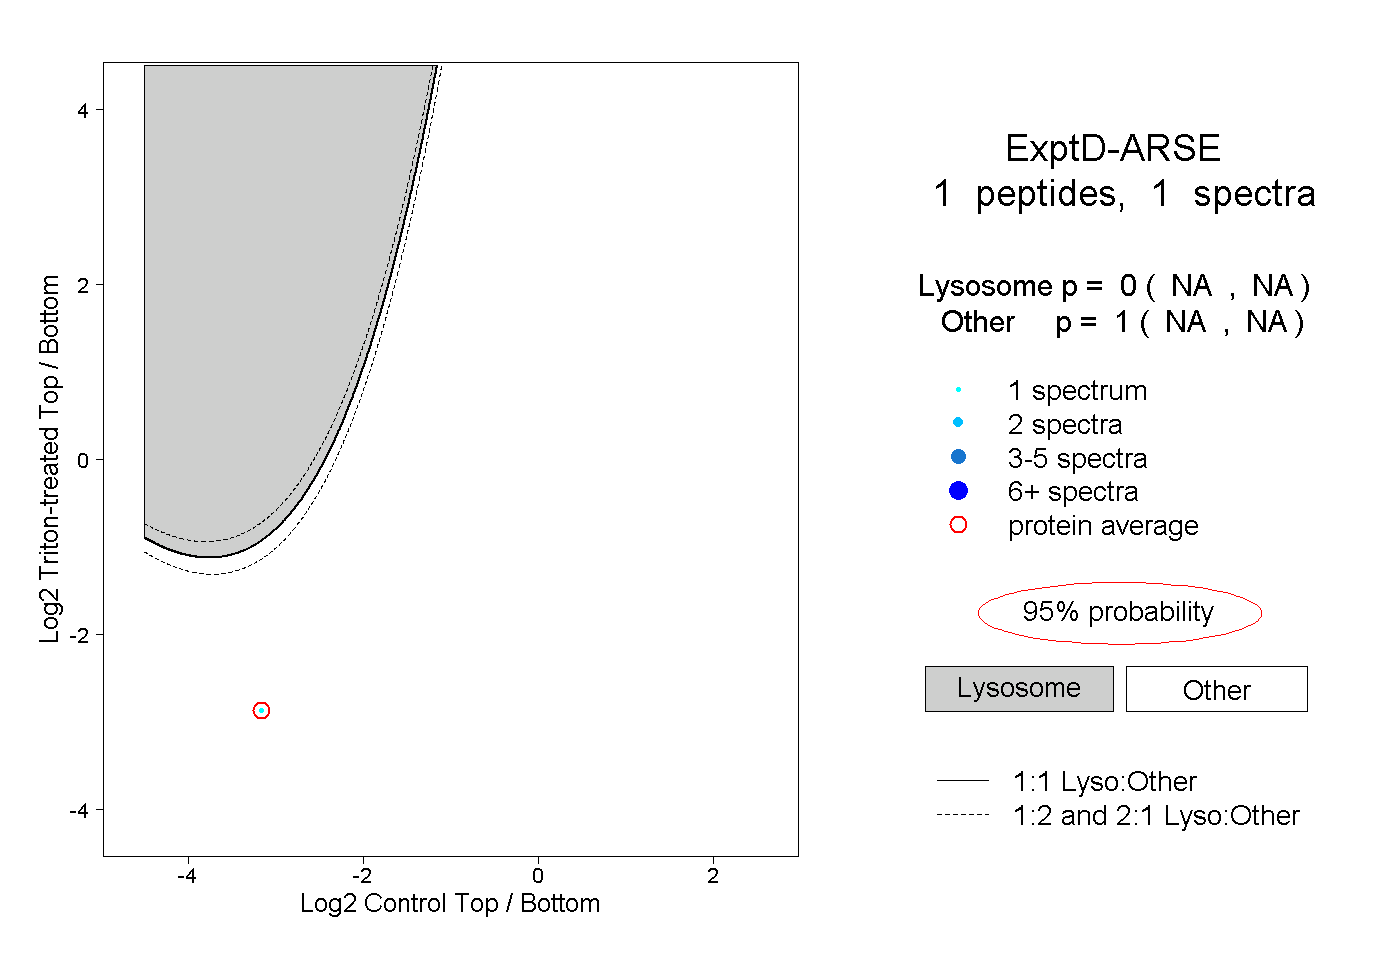 |
0.000 NA | NA |
1.000 NA | NA |