 2
2peptides
spectra
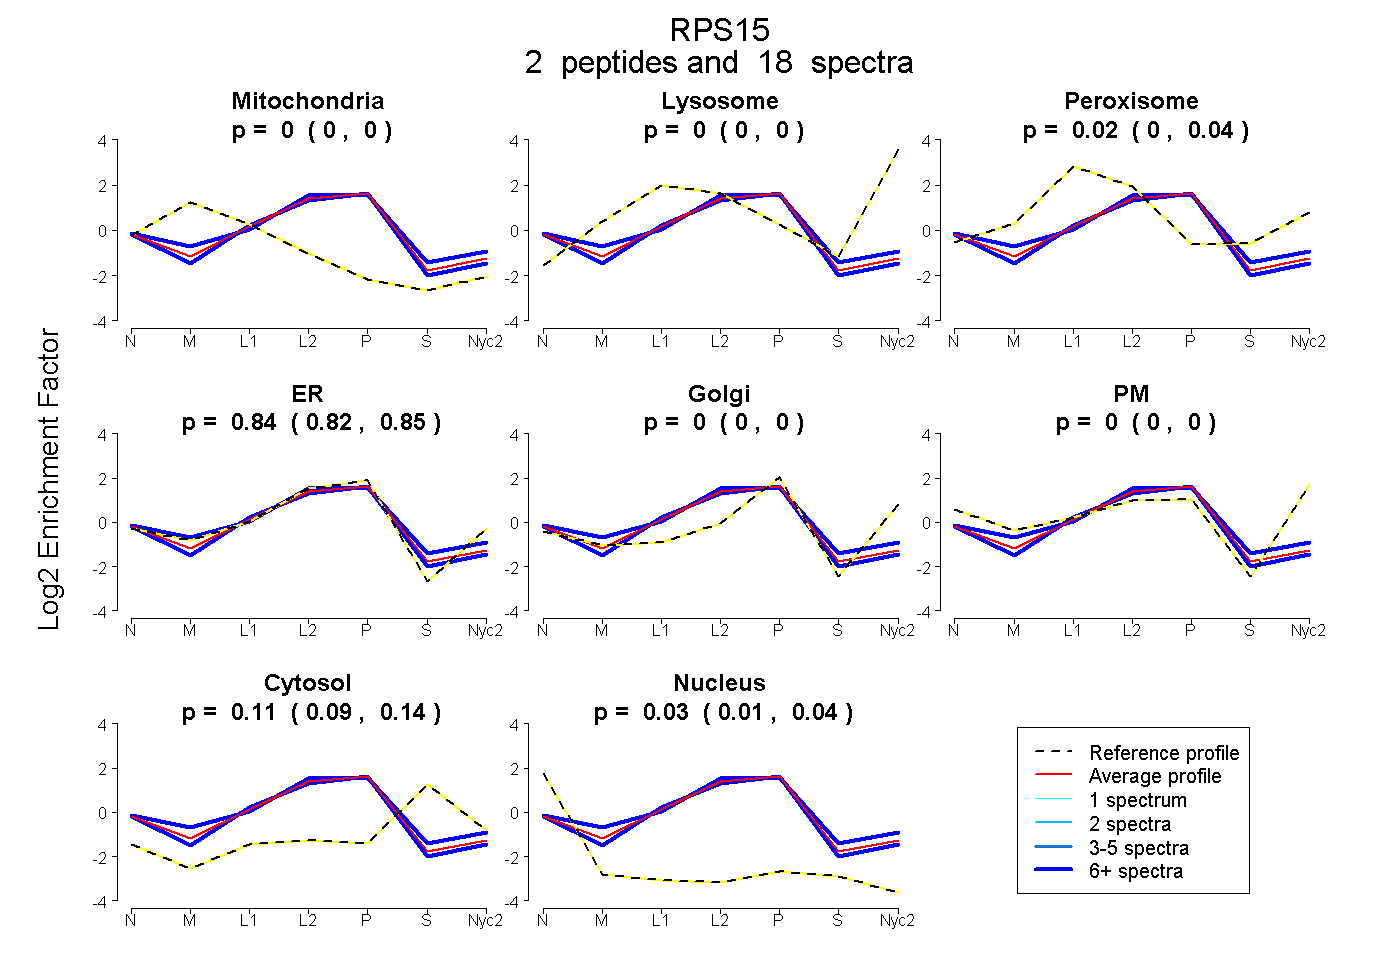
0.000 | 0.000
0.000 | 0.000
0.004 | 0.038
0.817 | 0.854
0.000 | 0.000
0.000 | 0.000
0.086 | 0.138
0.011 | 0.043
4peptides
spectra
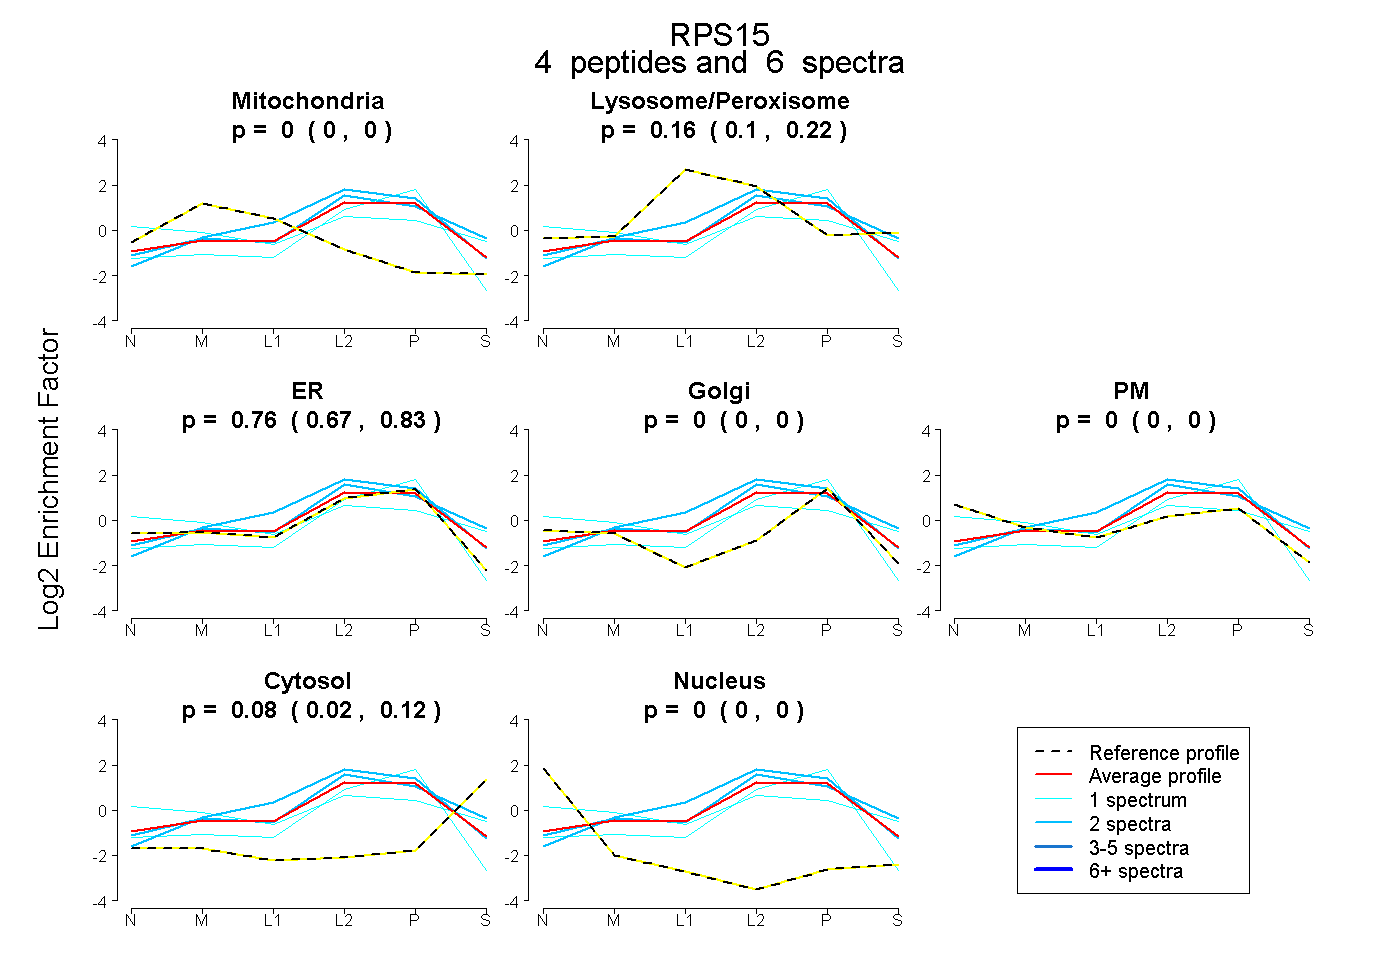
0.000 | 0.000
0.104 | 0.218
0.668 | 0.834
0.000 | 0.000
0.000 | 0.000
0.024 | 0.117
0.000 | 0.000
4peptides
spectra
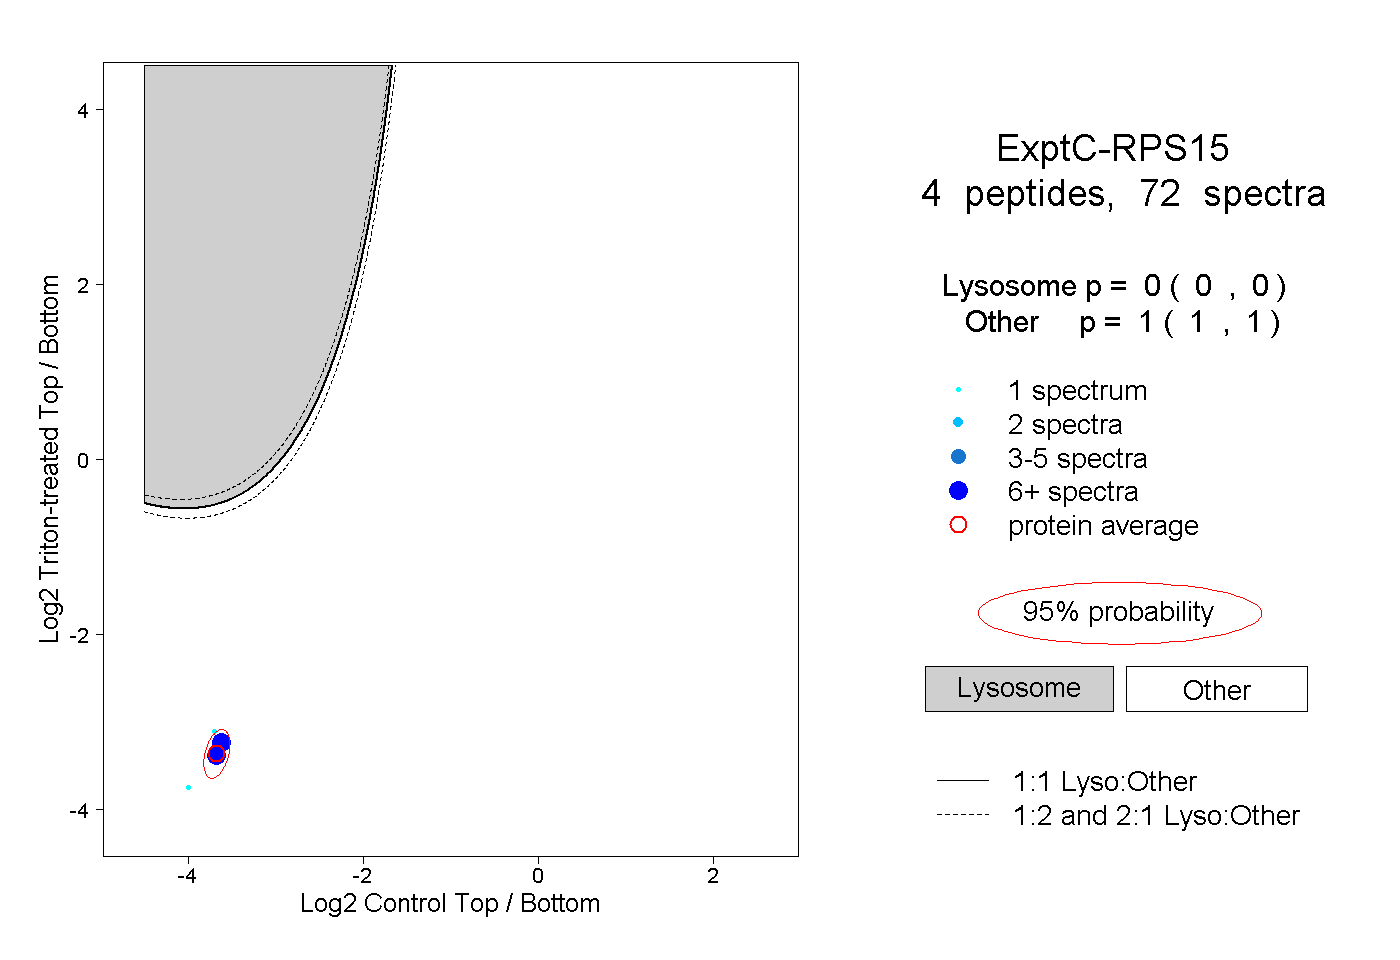
0.000 | 0.000
1.000 | 1.000
1peptide
spectrum

NA | NA
NA | NA