 2
2peptides
spectra
0.000 | 0.000
0.000 | 0.000
0.004 | 0.038
0.817 | 0.854
0.000 | 0.000
0.000 | 0.000
0.086 | 0.138
0.011 | 0.043
| Plot | Mito | Lyso | Perox | ER | Golgi | PM | Cytosol | Nucleus | |||||
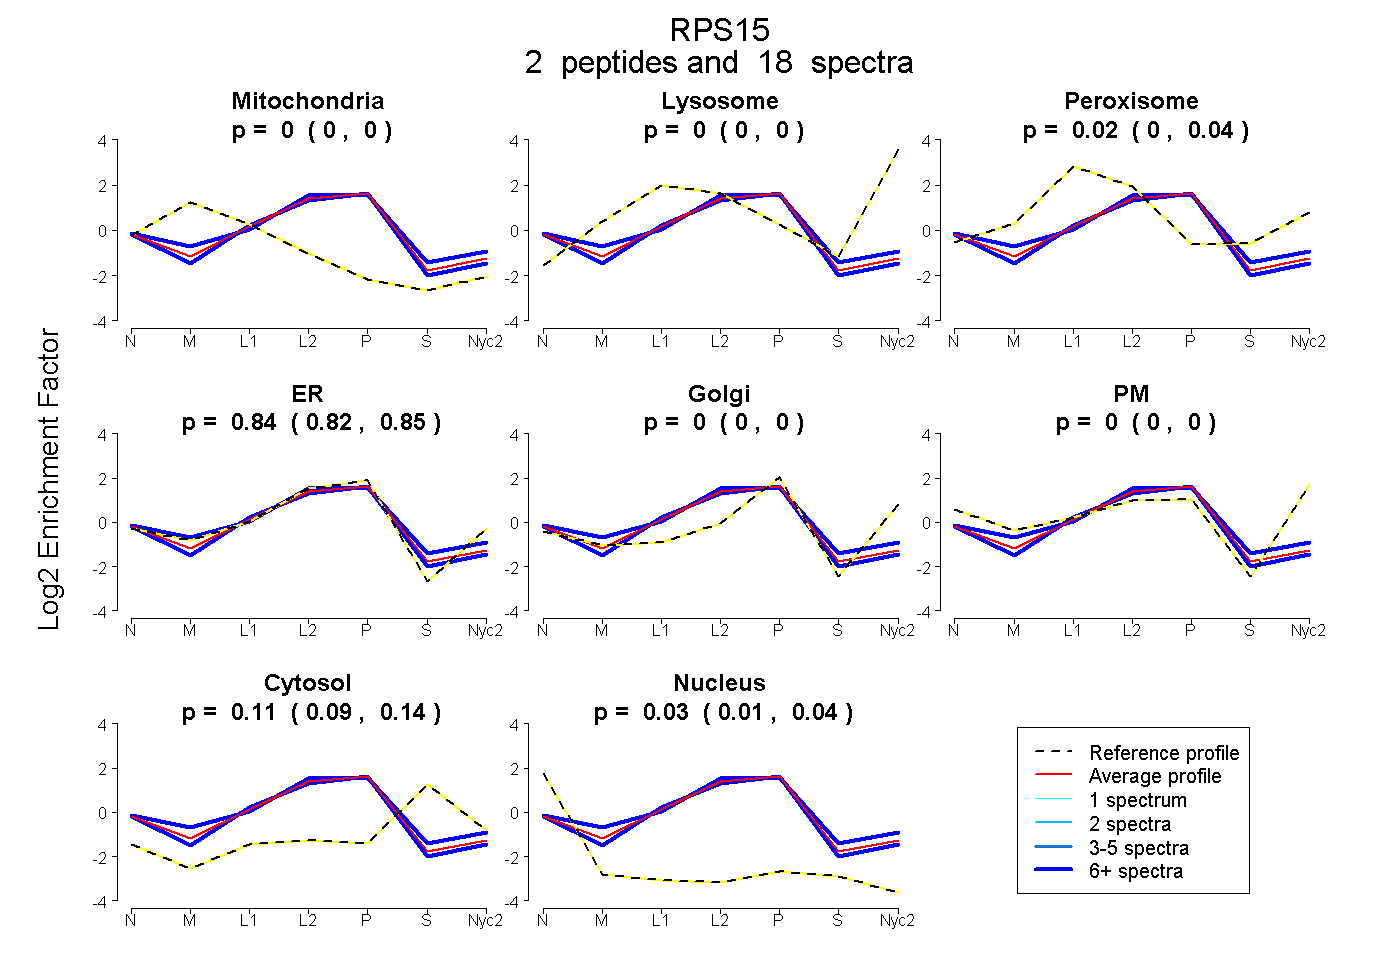
| Expt A |
2 peptides |
18 spectra |
|
0.000 0.000 | 0.000 |
0.000 0.000 | 0.000 |
0.023 0.004 | 0.038 |
0.837 0.817 | 0.854 |
0.000 0.000 | 0.000 |
0.000 0.000 | 0.000 |
0.113 0.086 | 0.138 |
0.028 0.011 | 0.043 |
| 7 spectra, QHSLLK | 0.000 | 0.000 | 0.075 | 0.793 | 0.000 | 0.000 | 0.132 | 0.000 | ||
| 11 spectra, DMIILPEMVGSMVGVYNGK | 0.000 | 0.000 | 0.000 | 0.854 | 0.000 | 0.000 | 0.089 | 0.057 |
| Plot | Mito | Lyso or Perox | ER | Golgi | PM | Cytosol | Nucleus | ||||||
| Expt B |
4 peptides |
6 spectra |
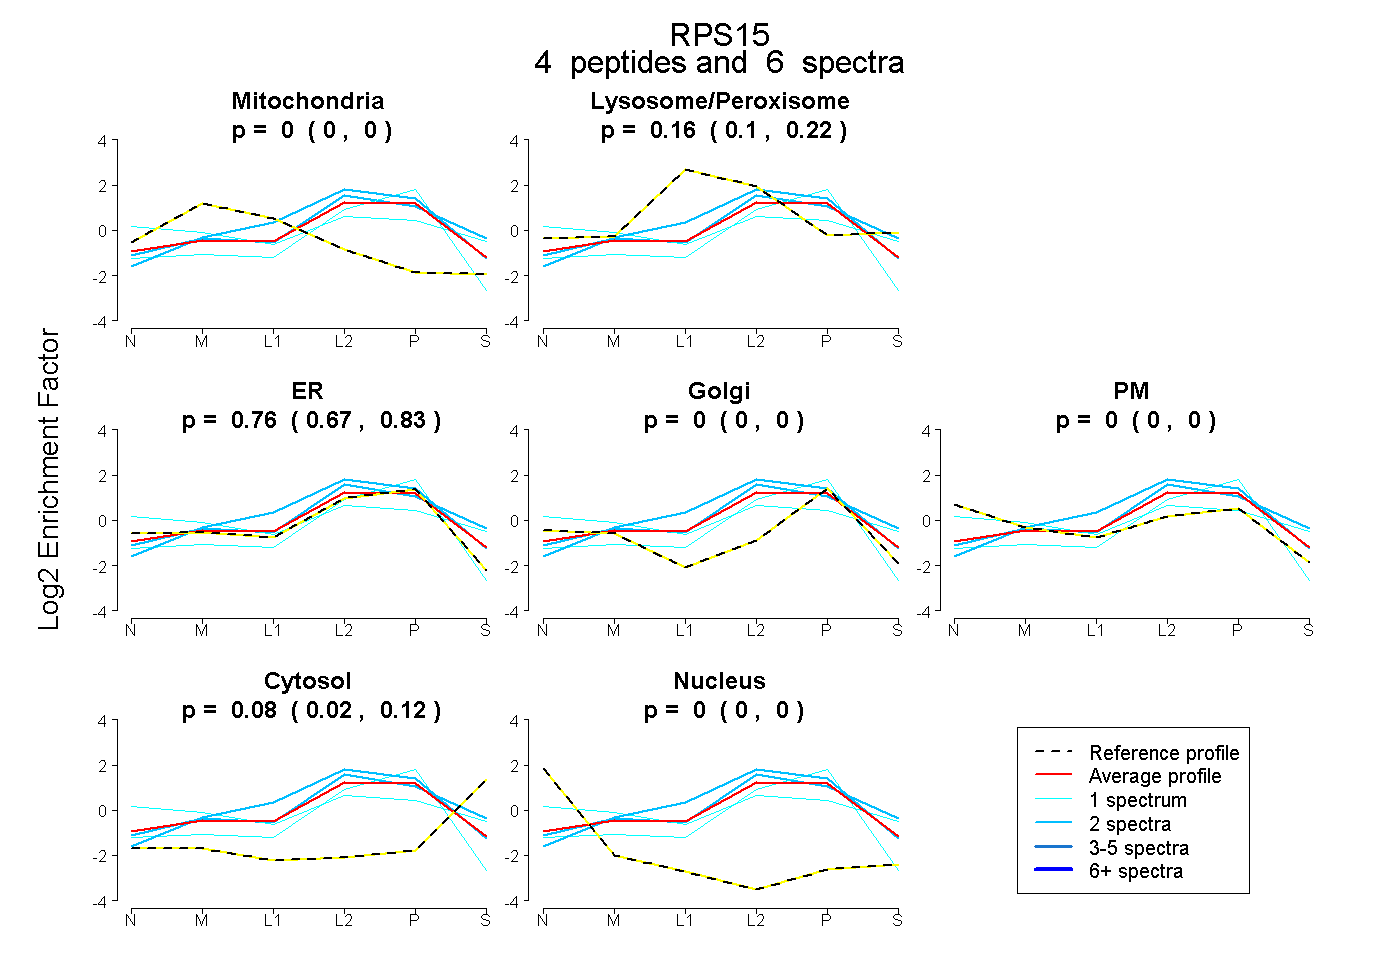 |
0.000 0.000 | 0.000 |
0.164 0.104 | 0.218 |
0.759 0.668 | 0.834 |
0.000 0.000 | 0.000 |
0.000 0.000 | 0.000 |
0.077 0.024 | 0.117 |
0.000 0.000 | 0.000 |
|||
| Plot | Lyso | Other | |||||||||||
| Expt C |
4 peptides |
72 spectra |
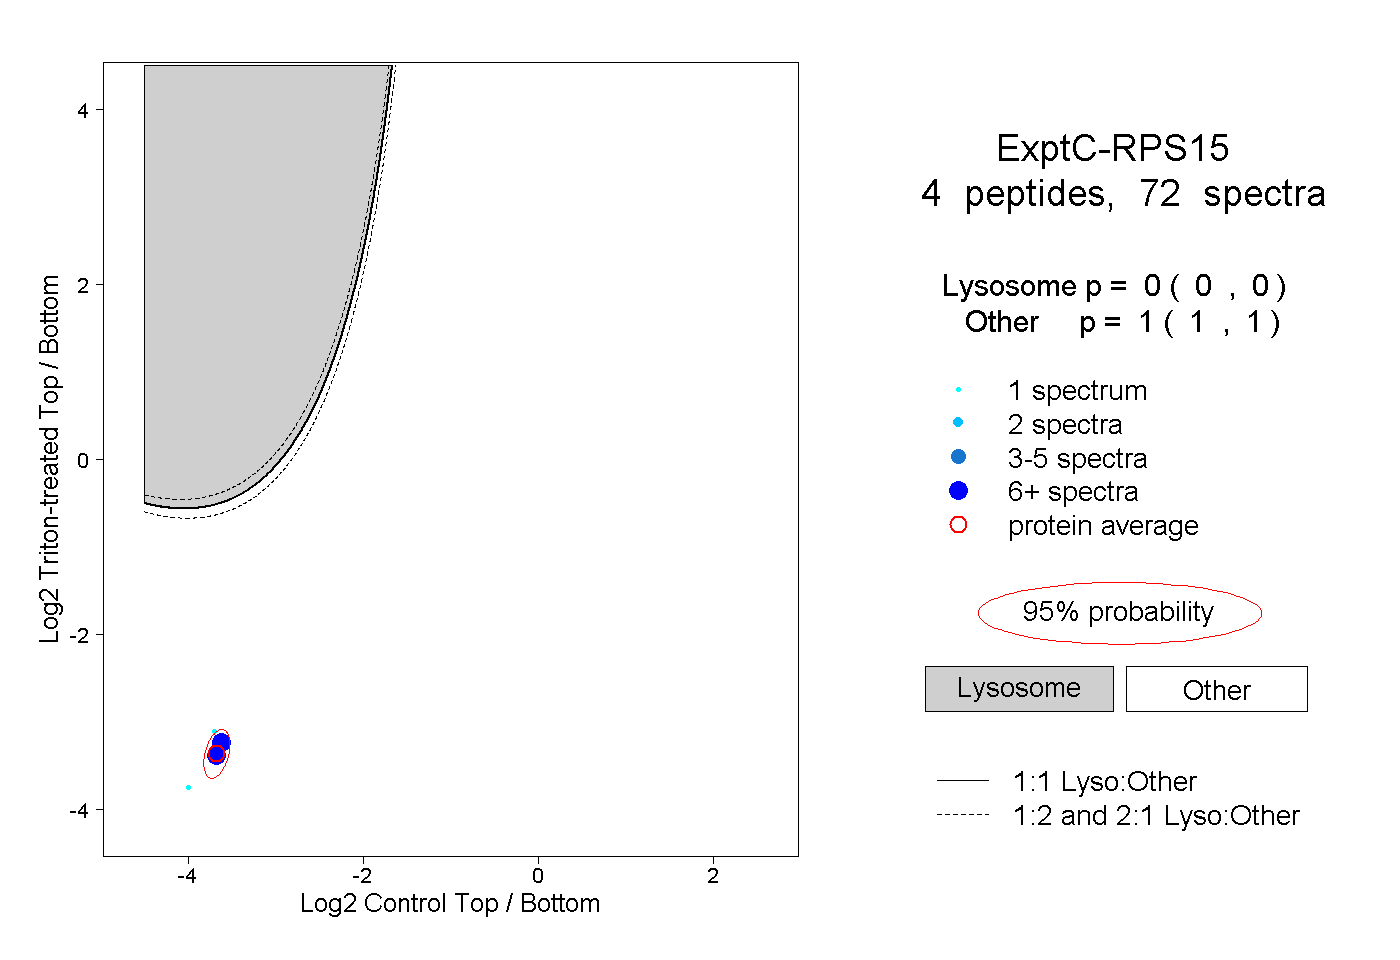 |
0.000 0.000 | 0.000 |
1.000 1.000 | 1.000 |
||||||||
| Plot | Lyso | Other | |||||||||||
| Expt D |
1 peptide |
1 spectrum |
 |
0.000 NA | NA |
1.000 NA | NA |