 9
9peptides
spectra
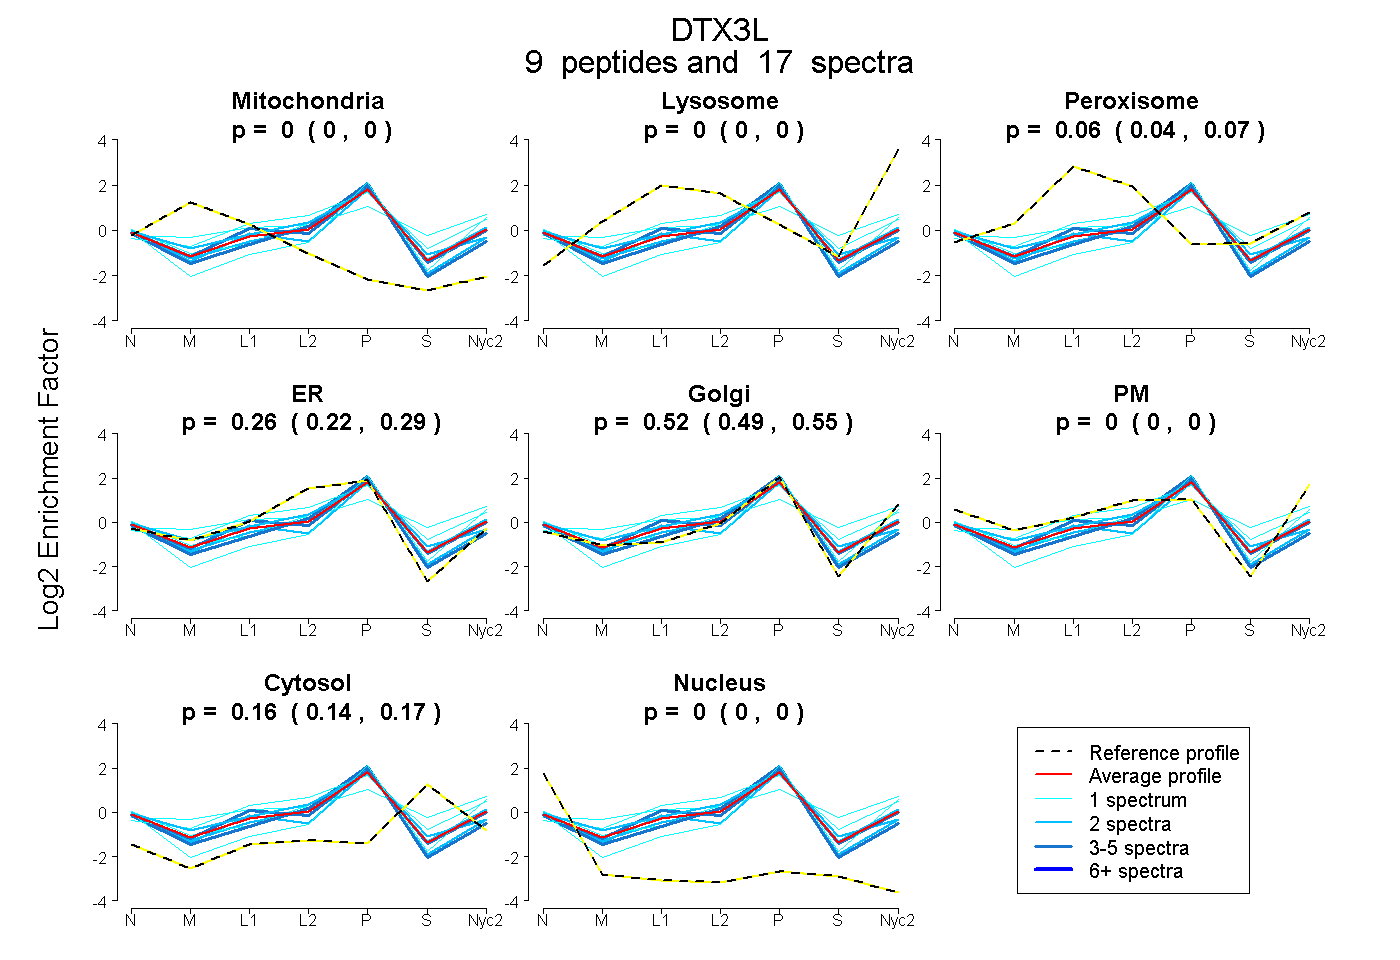
0.000 | 0.000
0.000 | 0.000
0.038 | 0.070
0.223 | 0.295
0.487 | 0.554
0.000 | 0.000
0.145 | 0.171
0.000 | 0.000
7peptides
spectra
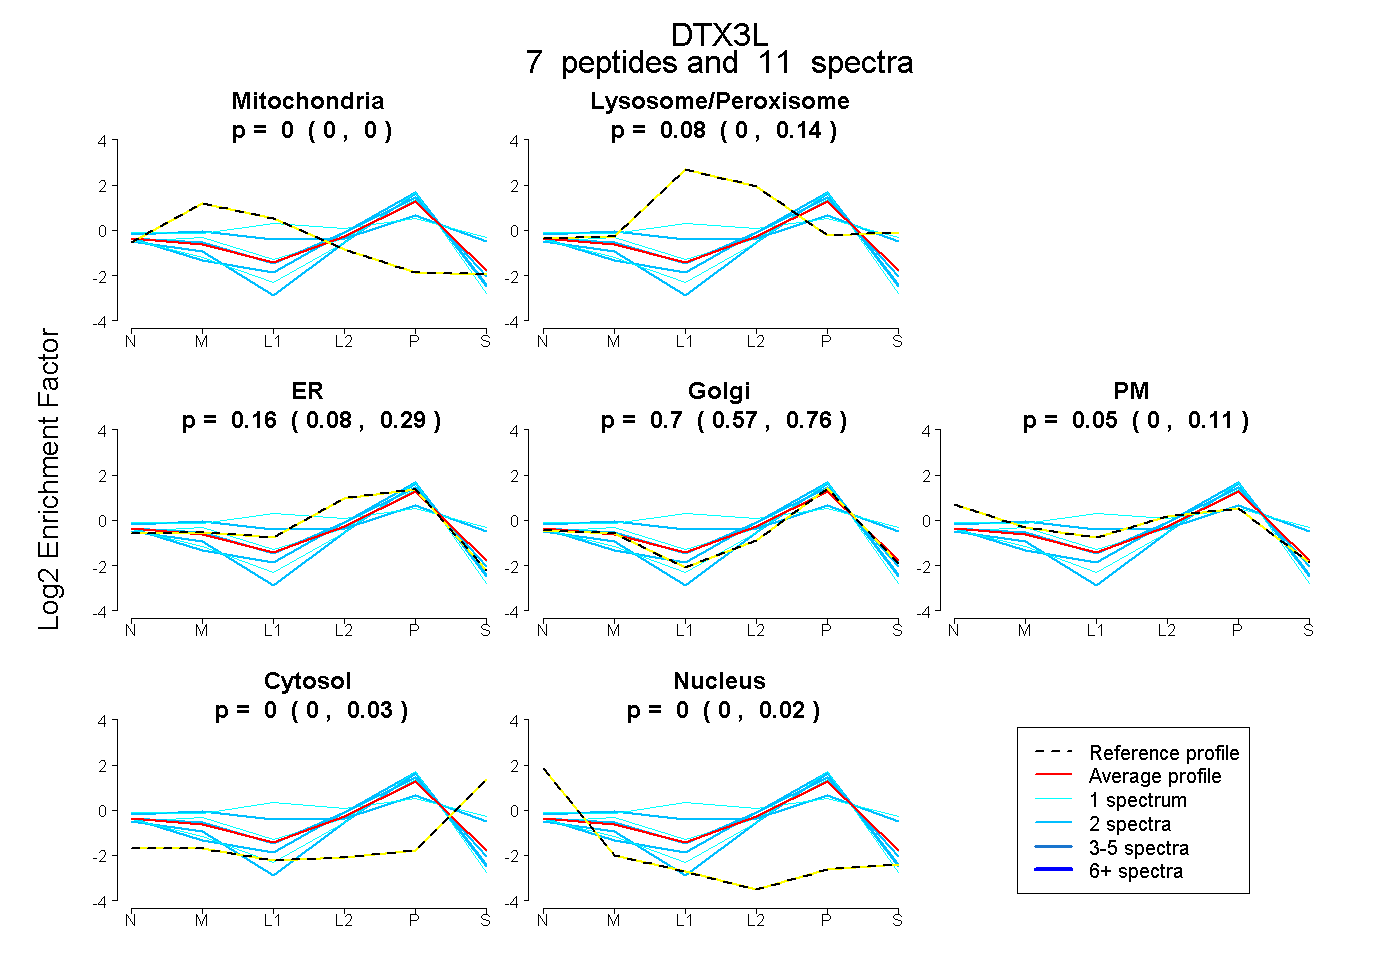
0.000 | 0.000
0.000 | 0.136
0.076 | 0.288
0.572 | 0.757
0.000 | 0.109
0.000 | 0.034
0.000 | 0.020
13peptides
spectra
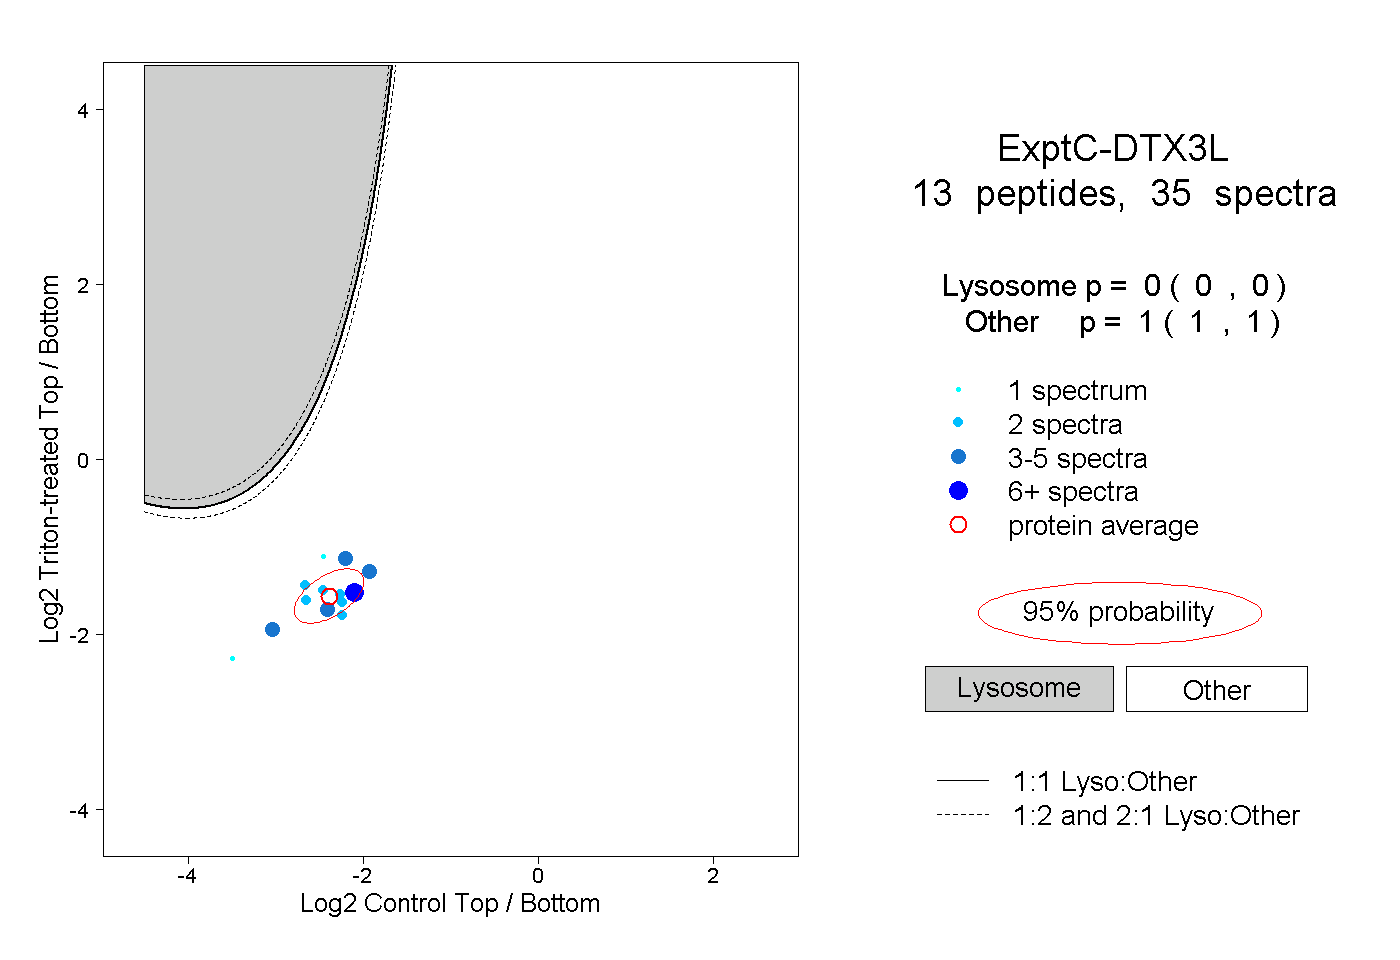
0.000 | 0.000
1.000 | 1.000
3peptides
spectra
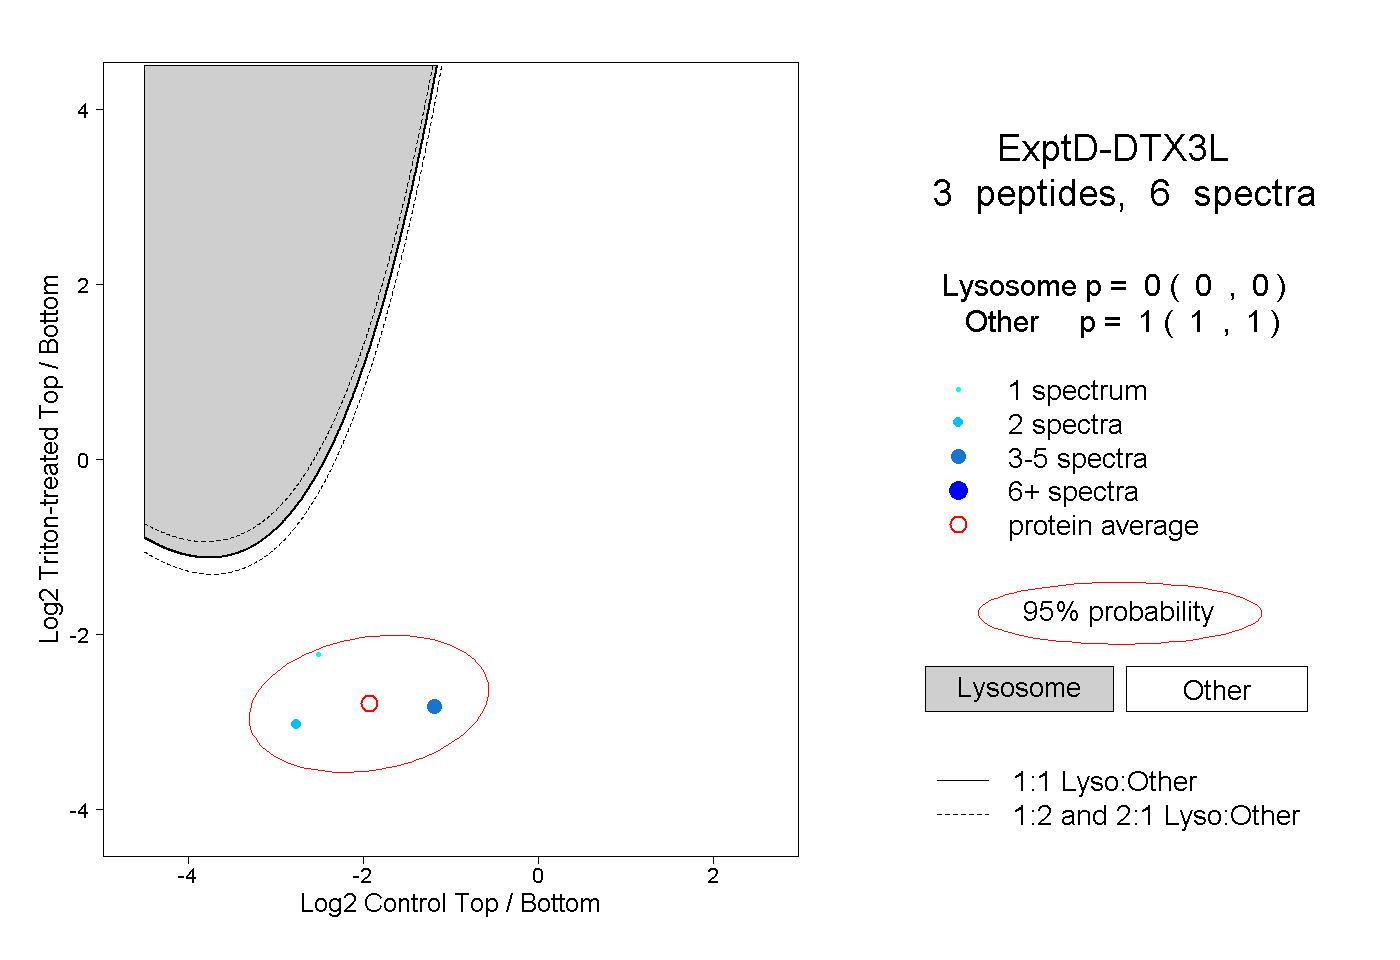
0.000 | 0.000
1.000 | 1.000