 9
9peptides
spectra
0.000 | 0.000
0.000 | 0.000
0.038 | 0.070
0.223 | 0.295
0.487 | 0.554
0.000 | 0.000
0.145 | 0.171
0.000 | 0.000
| Plot | Mito | Lyso | Perox | ER | Golgi | PM | Cytosol | Nucleus | |||||
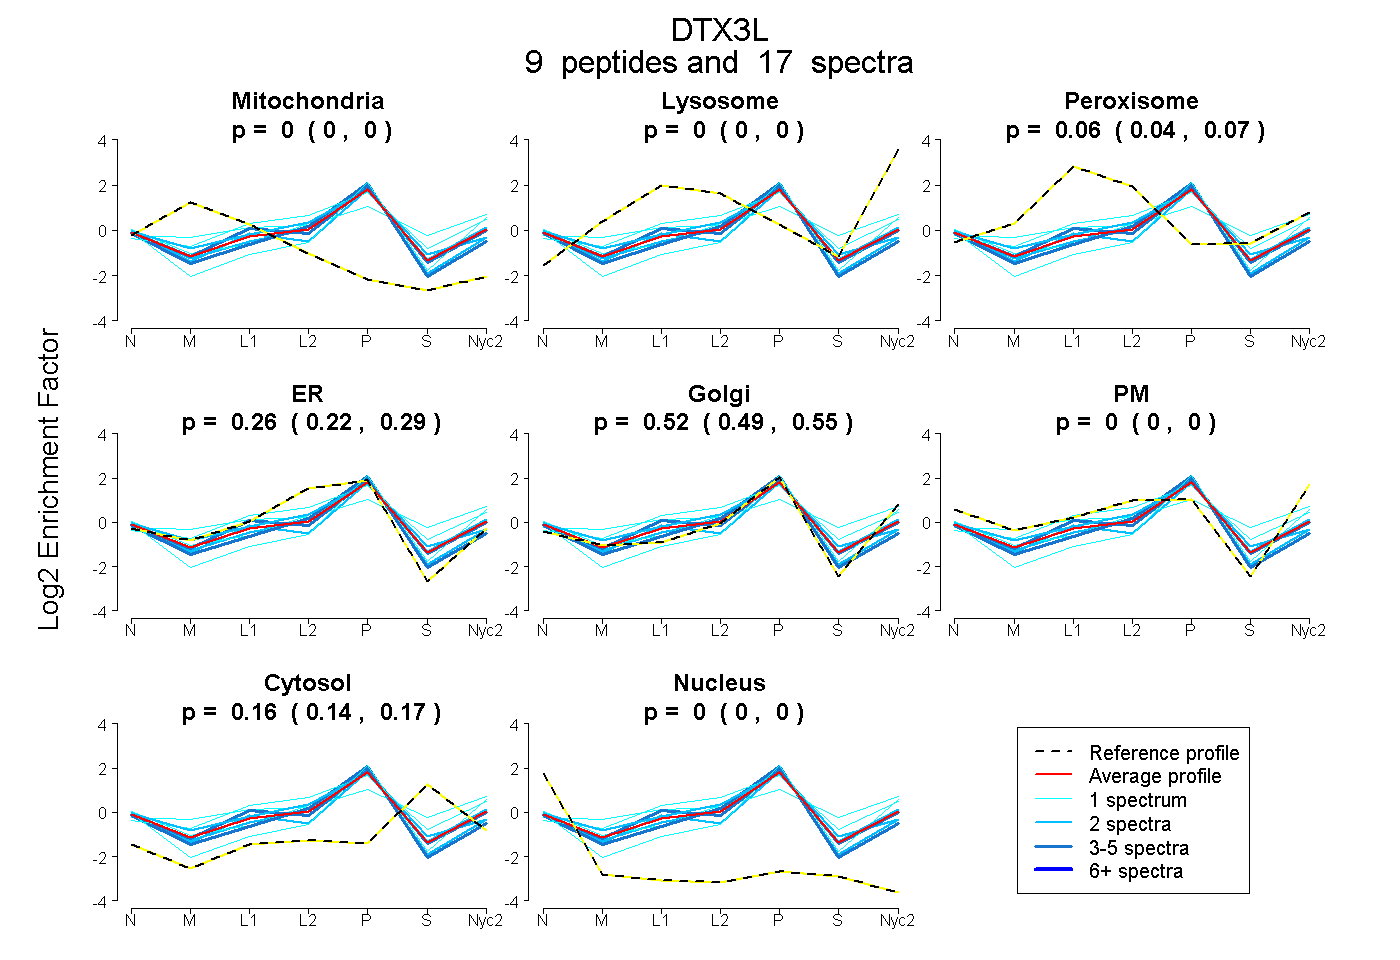
| Expt A |
9 peptides |
17 spectra |
|
0.000 0.000 | 0.000 |
0.000 0.000 | 0.000 |
0.055 0.038 | 0.070 |
0.260 0.223 | 0.295 |
0.525 0.487 | 0.554 |
0.000 0.000 | 0.000 |
0.160 0.145 | 0.171 |
0.000 0.000 | 0.000 |
| 3 spectra, QDCISLEDQQR | 0.000 | 0.000 | 0.000 | 0.437 | 0.428 | 0.000 | 0.067 | 0.068 | ||
| 4 spectra, LIFTVGESR | 0.000 | 0.000 | 0.095 | 0.207 | 0.564 | 0.000 | 0.133 | 0.001 | ||
| 2 spectra, AQITAVCPHIK | 0.000 | 0.000 | 0.000 | 0.393 | 0.469 | 0.000 | 0.083 | 0.055 | ||
| 2 spectra, VCGNFK | 0.000 | 0.000 | 0.119 | 0.269 | 0.492 | 0.000 | 0.119 | 0.000 | ||
| 1 spectrum, FNTCGK | 0.000 | 0.000 | 0.000 | 0.352 | 0.403 | 0.058 | 0.186 | 0.000 | ||
| 1 spectrum, SVPIVLETIK | 0.000 | 0.000 | 0.000 | 0.000 | 0.863 | 0.000 | 0.109 | 0.028 | ||
| 2 spectra, AYSGTCR | 0.000 | 0.000 | 0.032 | 0.220 | 0.511 | 0.000 | 0.220 | 0.017 | ||
| 1 spectrum, IHHFLSSQLLESEPTR | 0.000 | 0.050 | 0.285 | 0.000 | 0.435 | 0.026 | 0.204 | 0.000 | ||
| 1 spectrum, QSGNLEEACQSFVR | 0.000 | 0.000 | 0.283 | 0.125 | 0.493 | 0.000 | 0.099 | 0.000 |
| Plot | Mito | Lyso or Perox | ER | Golgi | PM | Cytosol | Nucleus | ||||||
| Expt B |
7 peptides |
11 spectra |
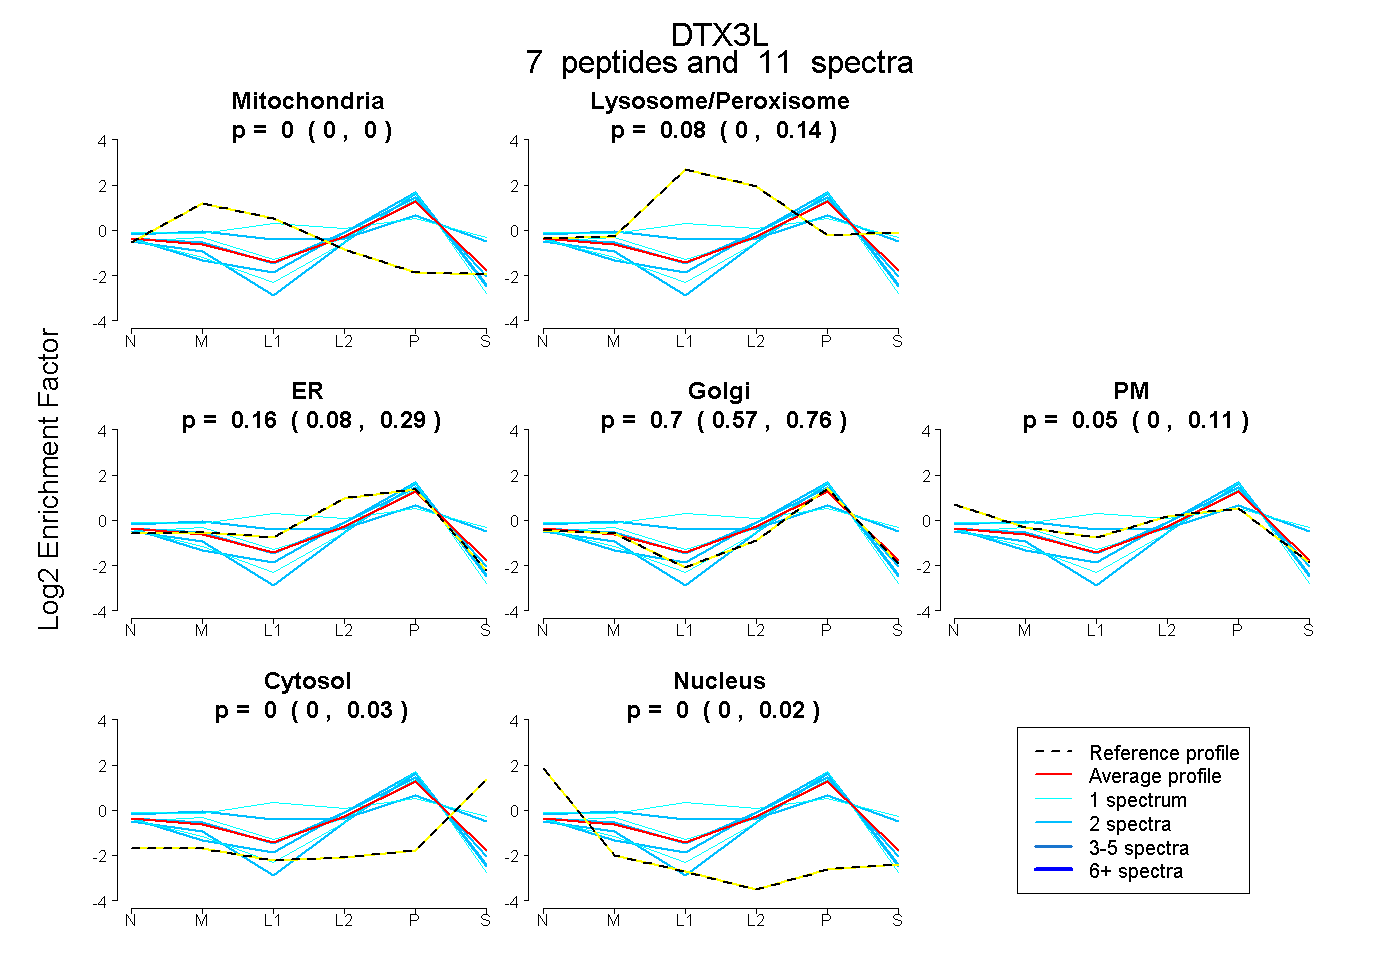 |
0.000 0.000 | 0.000 |
0.084 0.000 | 0.136 |
0.162 0.076 | 0.288 |
0.701 0.572 | 0.757 |
0.053 0.000 | 0.109 |
0.000 0.000 | 0.034 |
0.000 0.000 | 0.020 |
|||
| Plot | Lyso | Other | |||||||||||
| Expt C |
13 peptides |
35 spectra |
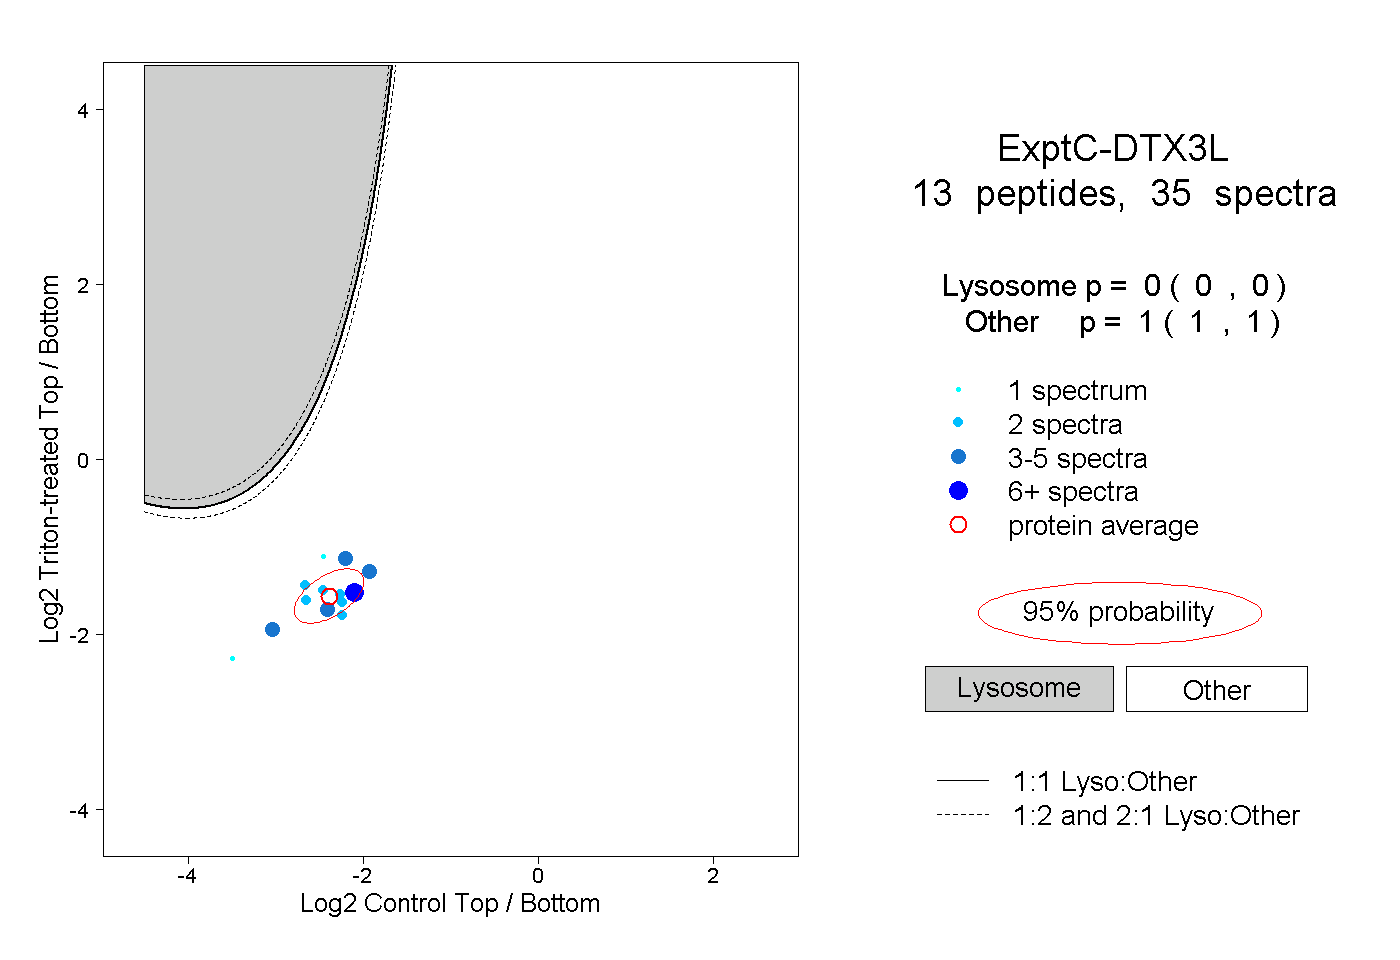 |
0.000 0.000 | 0.000 |
1.000 1.000 | 1.000 |
||||||||
| Plot | Lyso | Other | |||||||||||
| Expt D |
3 peptides |
6 spectra |
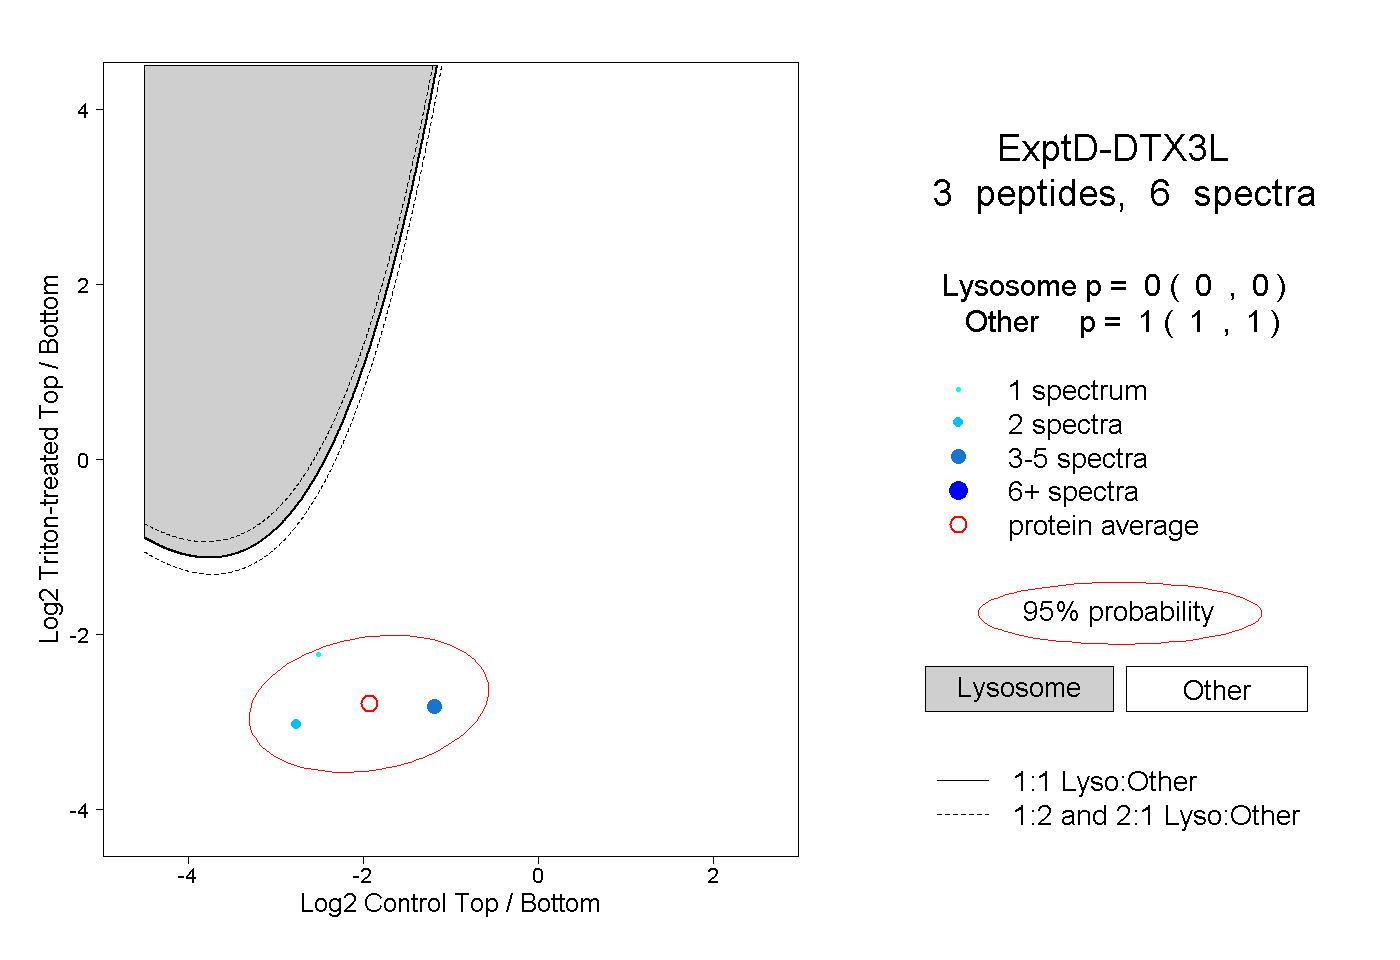 |
0.000 0.000 | 0.000 |
1.000 1.000 | 1.000 |