 23
23peptides
spectra

0.000 | 0.000
0.000 | 0.000
0.000 | 0.000
0.000 | 0.000
0.106 | 0.112
0.000 | 0.000
0.888 | 0.894
0.000 | 0.000
8peptides
spectra
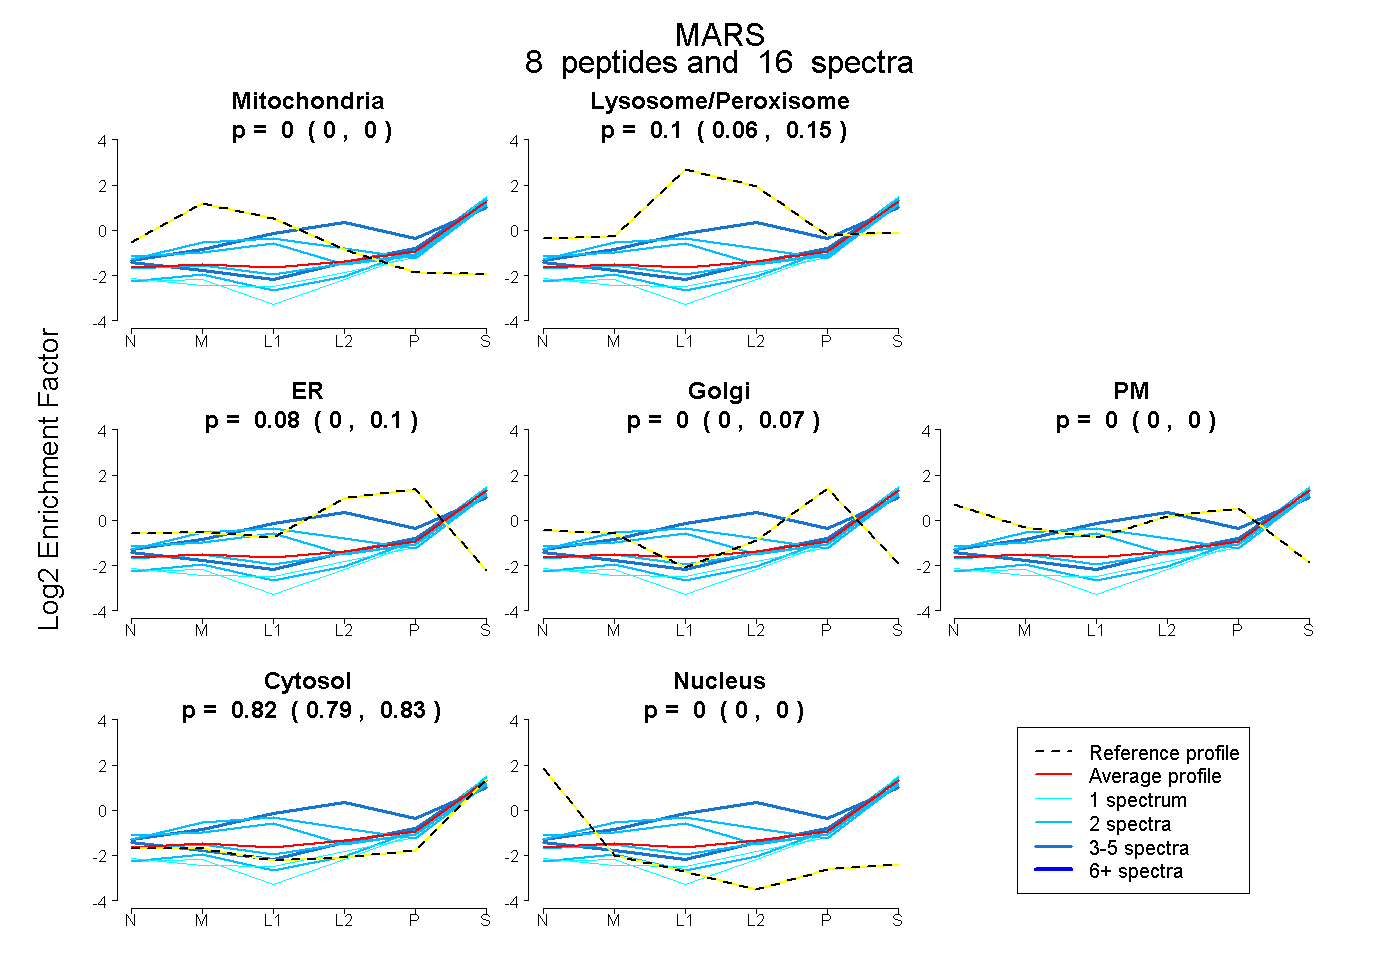
0.000 | 0.000
0.063 | 0.145
0.000 | 0.101
0.000 | 0.071
0.000 | 0.000
0.792 | 0.833
0.000 | 0.000
20peptides
spectra

0.000 | 0.000
1.000 | 1.000
4peptides
spectra
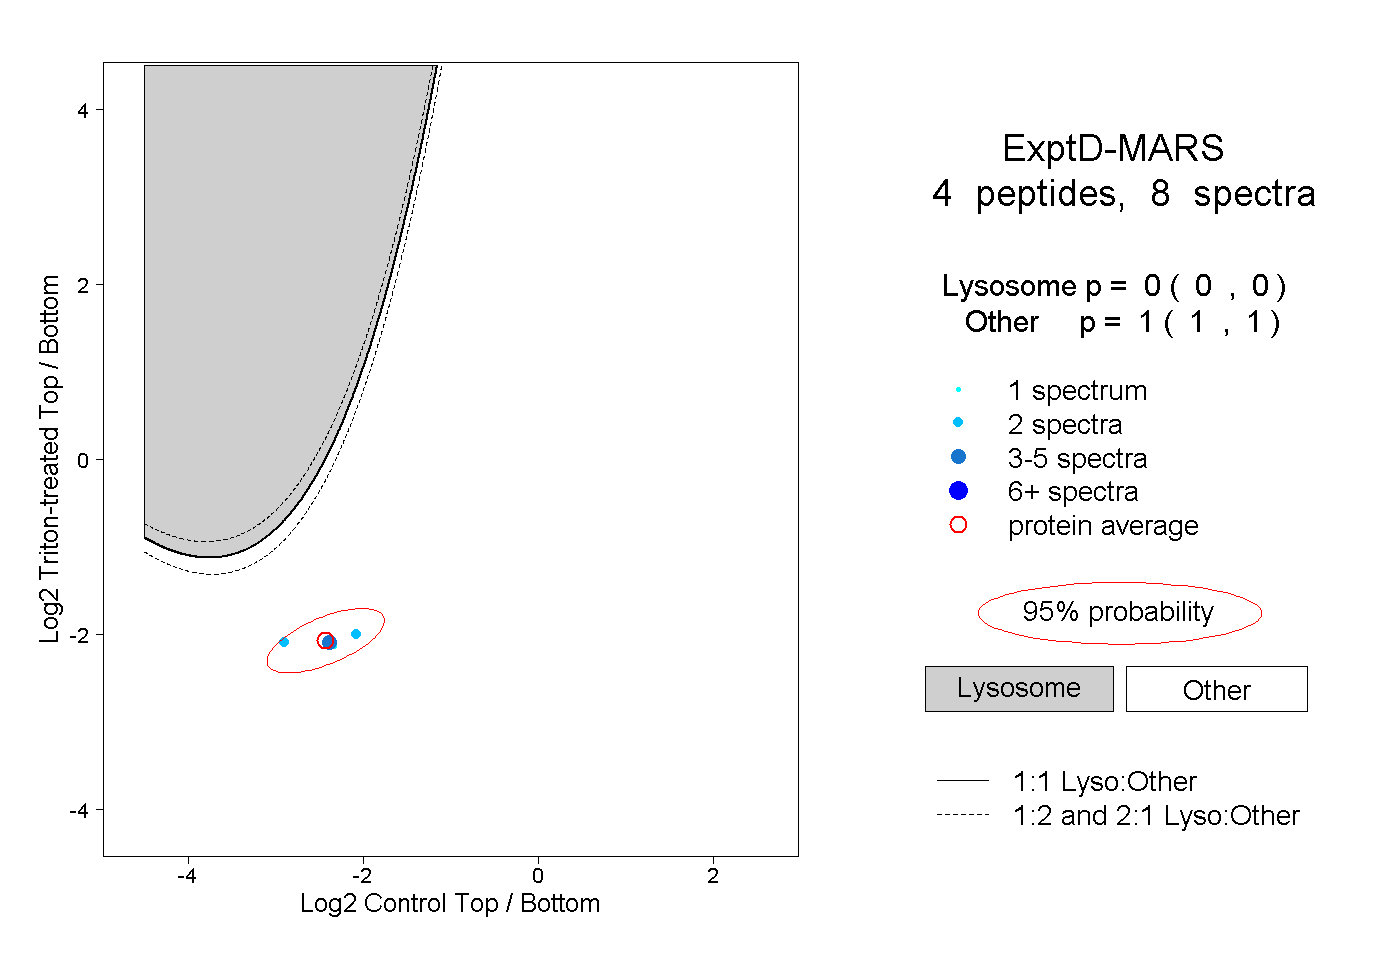
0.000 | 0.000
1.000 | 1.000