 23
23peptides
spectra

0.000 | 0.000
0.000 | 0.000
0.000 | 0.000
0.000 | 0.000
0.106 | 0.112
0.000 | 0.000
0.888 | 0.894
0.000 | 0.000
| Plot | Mito | Lyso | Perox | ER | Golgi | PM | Cytosol | Nucleus | |||||
| Expt A |
23 peptides |
62 spectra |
|
0.000 0.000 | 0.000 |
0.000 0.000 | 0.000 |
0.000 0.000 | 0.000 |
0.000 0.000 | 0.000 |
0.109 0.106 | 0.112 |
0.000 0.000 | 0.000 |
0.891 0.888 | 0.894 |
0.000 0.000 | 0.000 |
| 4 spectra, SILTISR | 0.046 | 0.000 | 0.000 | 0.000 | 0.103 | 0.000 | 0.850 | 0.000 | ||
| 9 spectra, NQVAAEVAK | 0.000 | 0.000 | 0.000 | 0.000 | 0.271 | 0.000 | 0.653 | 0.076 | ||
| 6 spectra, AGMFVSK | 0.000 | 0.102 | 0.000 | 0.000 | 0.070 | 0.000 | 0.827 | 0.000 | ||
| 1 spectrum, NPEQVDLYQFMAK | 0.000 | 0.000 | 0.000 | 0.000 | 0.000 | 0.000 | 0.982 | 0.018 | ||
| 1 spectrum, LFVSEGSPGSLPVLAAAAR | 0.000 | 0.000 | 0.000 | 0.000 | 0.090 | 0.000 | 0.910 | 0.000 | ||
| 3 spectra, HLFLDLPK | 0.000 | 0.000 | 0.000 | 0.000 | 0.000 | 0.000 | 0.985 | 0.015 | ||
| 2 spectra, FGGGQAK | 0.000 | 0.000 | 0.000 | 0.000 | 0.110 | 0.000 | 0.890 | 0.000 | ||
| 1 spectrum, LINAIELK | 0.000 | 0.000 | 0.000 | 0.000 | 0.044 | 0.000 | 0.956 | 0.000 | ||
| 1 spectrum, TTTPLQTK | 0.000 | 0.000 | 0.000 | 0.000 | 0.088 | 0.000 | 0.912 | 0.000 | ||
| 1 spectrum, VLTHIDHSLSR | 0.000 | 0.027 | 0.115 | 0.169 | 0.071 | 0.000 | 0.618 | 0.000 | ||
| 4 spectra, GLENLPPLQPQQHPVLPVPGER | 0.000 | 0.111 | 0.000 | 0.000 | 0.103 | 0.000 | 0.786 | 0.000 | ||
| 2 spectra, YHAIHVDIYR | 0.000 | 0.000 | 0.000 | 0.000 | 0.000 | 0.000 | 0.933 | 0.067 | ||
| 4 spectra, TMPGSDWTPNAR | 0.000 | 0.000 | 0.000 | 0.000 | 0.065 | 0.000 | 0.935 | 0.000 | ||
| 2 spectra, GDQCDK | 0.000 | 0.000 | 0.000 | 0.000 | 0.000 | 0.000 | 0.932 | 0.068 | ||
| 5 spectra, AAETVLK | 0.000 | 0.004 | 0.079 | 0.000 | 0.181 | 0.000 | 0.737 | 0.000 | ||
| 4 spectra, GFVLQDTVEQLR | 0.000 | 0.000 | 0.000 | 0.000 | 0.037 | 0.000 | 0.963 | 0.000 | ||
| 1 spectrum, IGTVSPLFQK | 0.000 | 0.000 | 0.000 | 0.000 | 0.095 | 0.000 | 0.905 | 0.000 | ||
| 2 spectra, YHQLLEK | 0.198 | 0.000 | 0.000 | 0.083 | 0.015 | 0.000 | 0.700 | 0.004 | ||
| 2 spectra, NNSELLNNLGNFINR | 0.000 | 0.074 | 0.000 | 0.000 | 0.117 | 0.000 | 0.810 | 0.000 | ||
| 2 spectra, LENDQIENLR | 0.000 | 0.034 | 0.000 | 0.000 | 0.072 | 0.000 | 0.894 | 0.000 | ||
| 2 spectra, CEQCAR | 0.000 | 0.000 | 0.000 | 0.058 | 0.000 | 0.000 | 0.934 | 0.008 | ||
| 2 spectra, QQGVLALRPYLQK | 0.000 | 0.008 | 0.000 | 0.000 | 0.121 | 0.000 | 0.871 | 0.000 | ||
| 1 spectrum, GIGVFGDMAQDTGIPADIWR | 0.054 | 0.008 | 0.000 | 0.003 | 0.019 | 0.000 | 0.916 | 0.000 |
| Plot | Mito | Lyso or Perox | ER | Golgi | PM | Cytosol | Nucleus | ||||||
| Expt B |
8 peptides |
16 spectra |
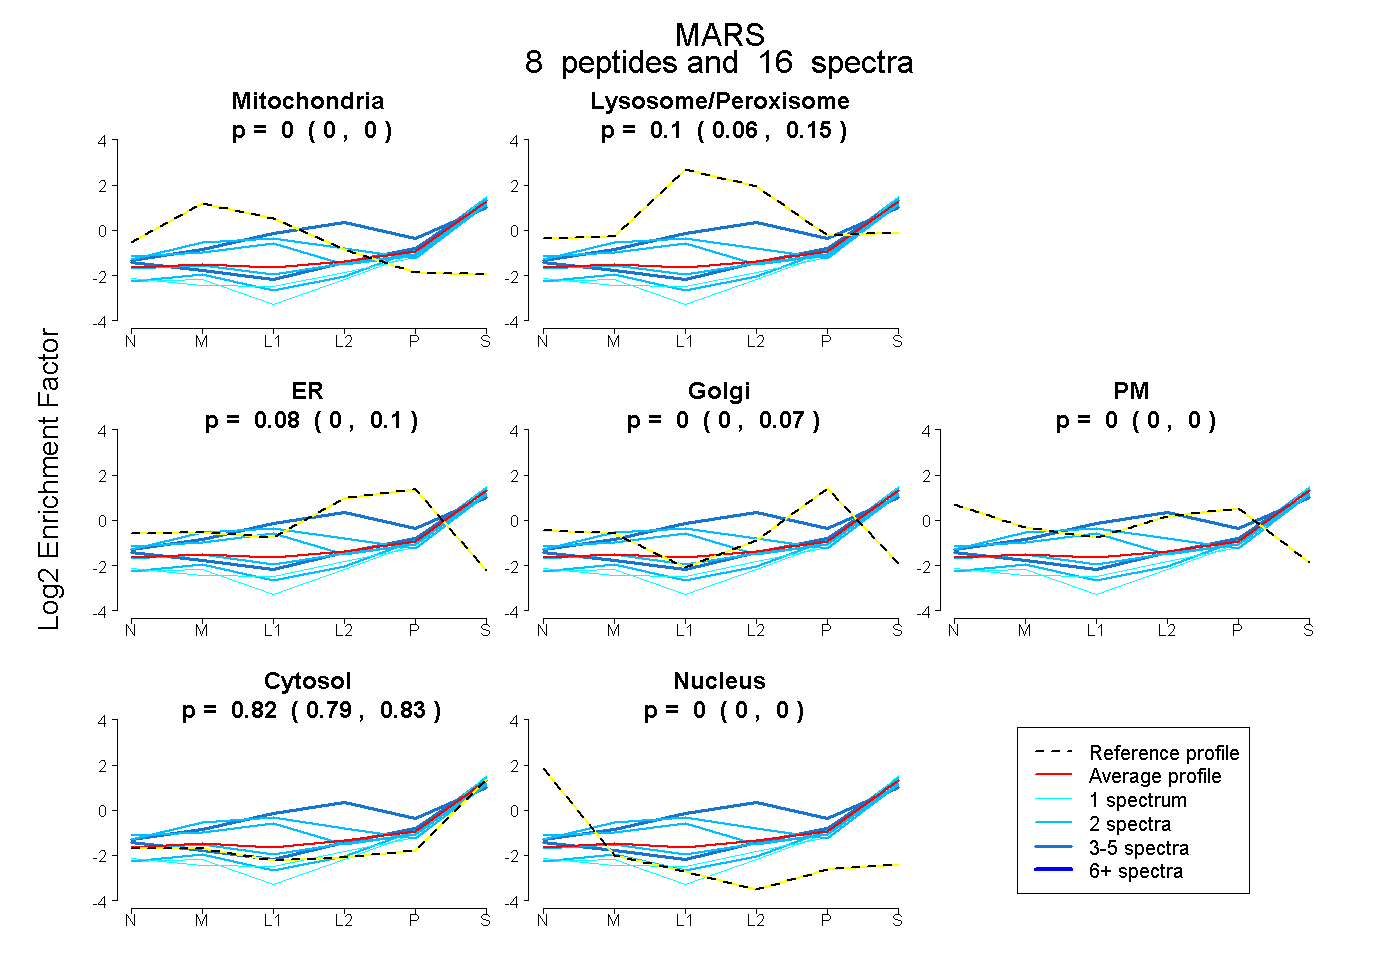 |
0.000 0.000 | 0.000 |
0.101 0.063 | 0.145 |
0.077 0.000 | 0.101 |
0.002 0.000 | 0.071 |
0.000 0.000 | 0.000 |
0.820 0.792 | 0.833 |
0.000 0.000 | 0.000 |
|||
| Plot | Lyso | Other | |||||||||||
| Expt C |
20 peptides |
50 spectra |
 |
0.000 0.000 | 0.000 |
1.000 1.000 | 1.000 |
||||||||
| Plot | Lyso | Other | |||||||||||
| Expt D |
4 peptides |
8 spectra |
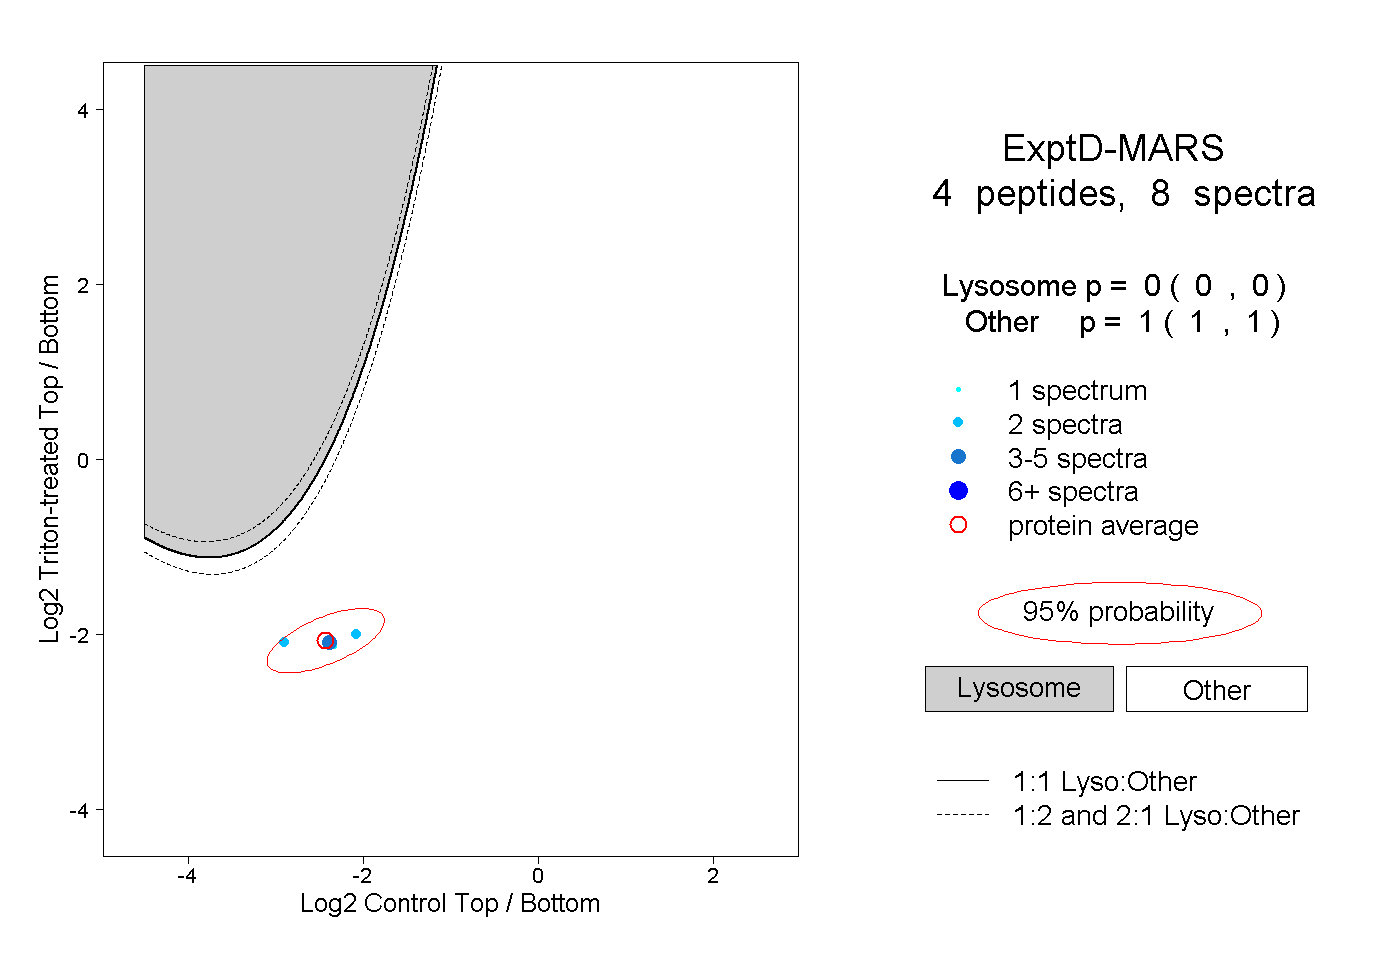 |
0.000 0.000 | 0.000 |
1.000 1.000 | 1.000 |