 37
37peptides
spectra
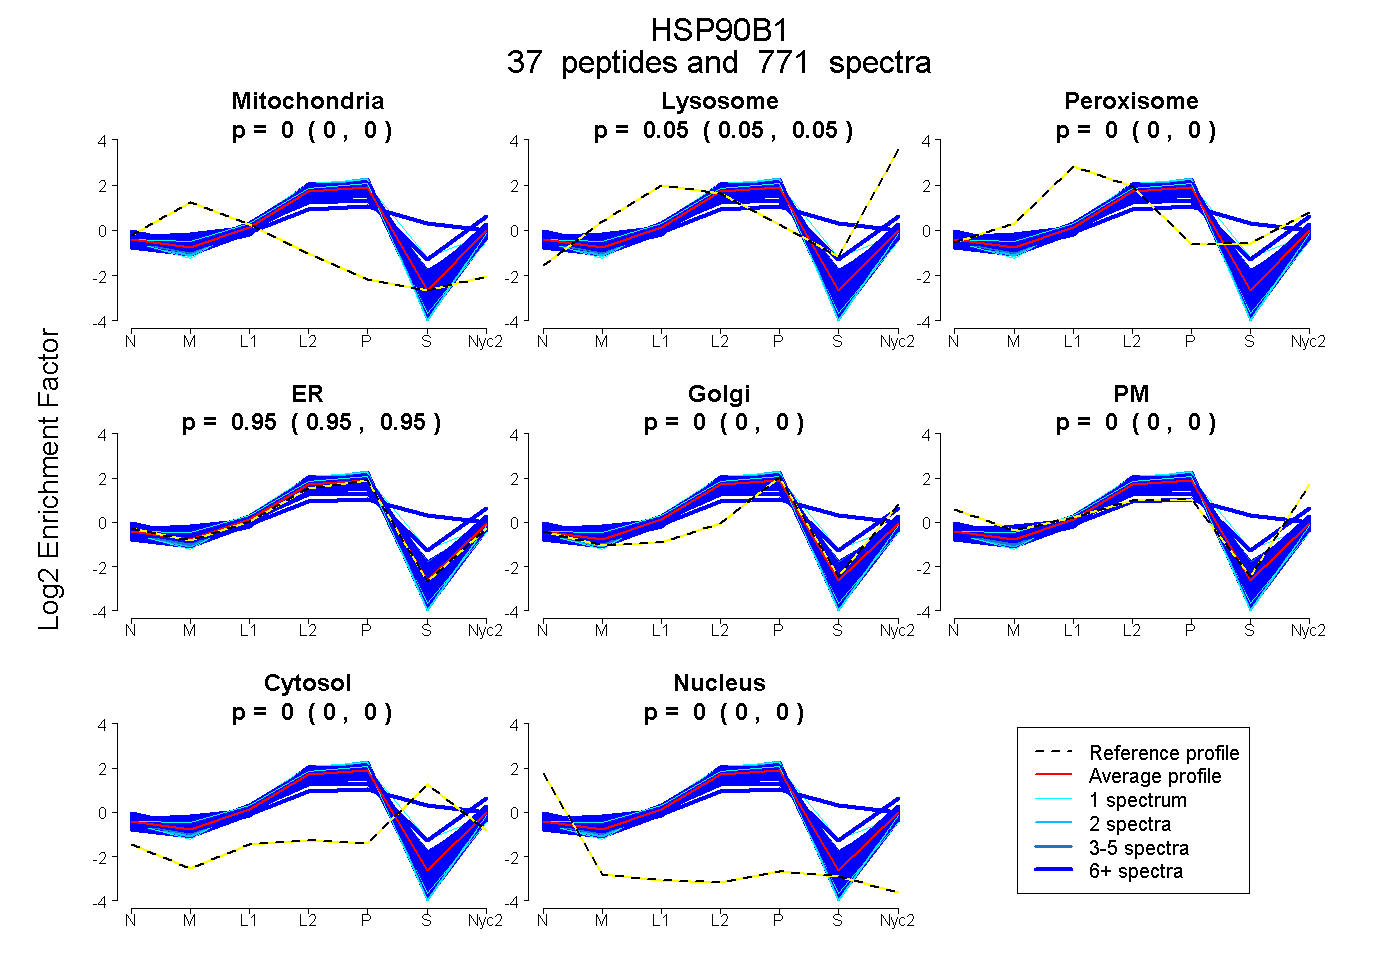
0.000 | 0.000
0.051 | 0.052
0.000 | 0.000
0.948 | 0.949
0.000 | 0.000
0.000 | 0.000
0.000 | 0.000
0.000 | 0.000
35peptides
spectra
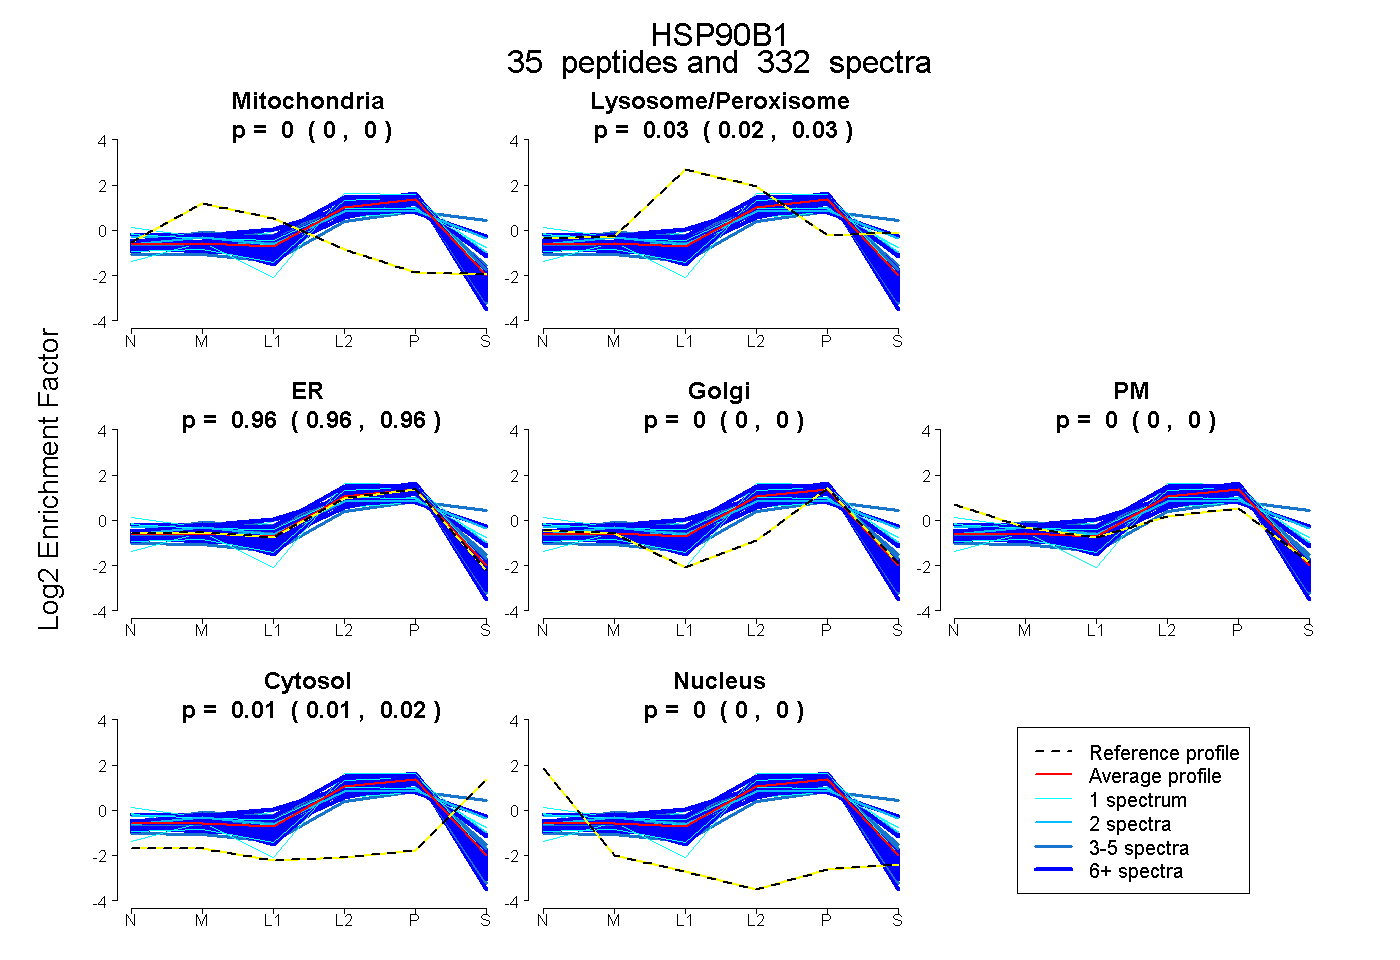
0.000 | 0.000
0.023 | 0.027
0.957 | 0.963
0.000 | 0.000
0.000 | 0.000
0.013 | 0.016
0.000 | 0.000
35peptides
spectra

0.000 | 0.000
1.000 | 1.000
29peptides
spectra
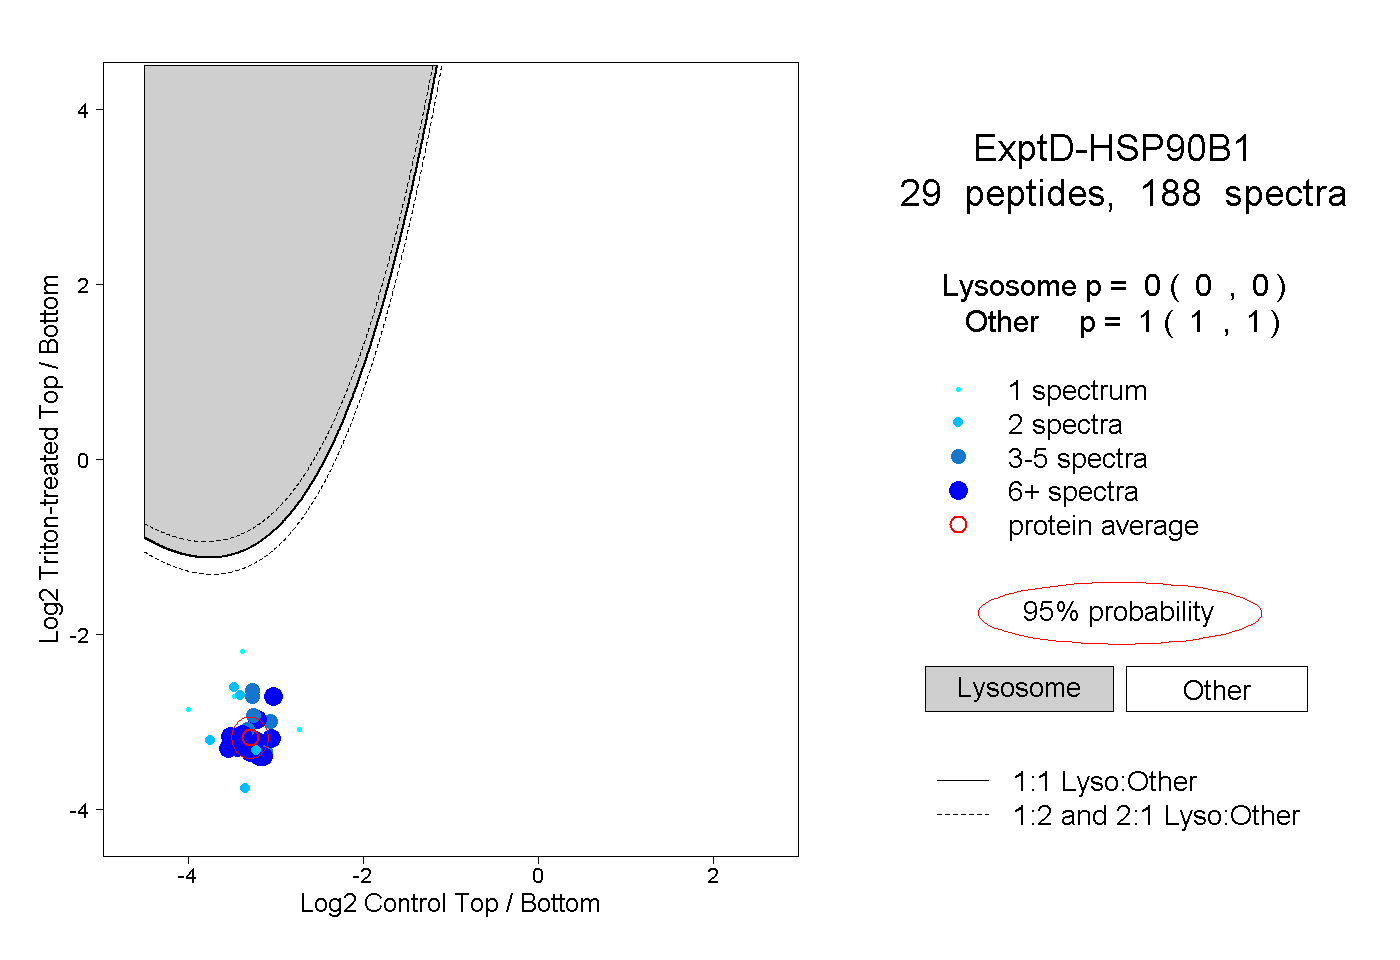
0.000 | 0.000
1.000 | 1.000