 5
5peptides
spectra
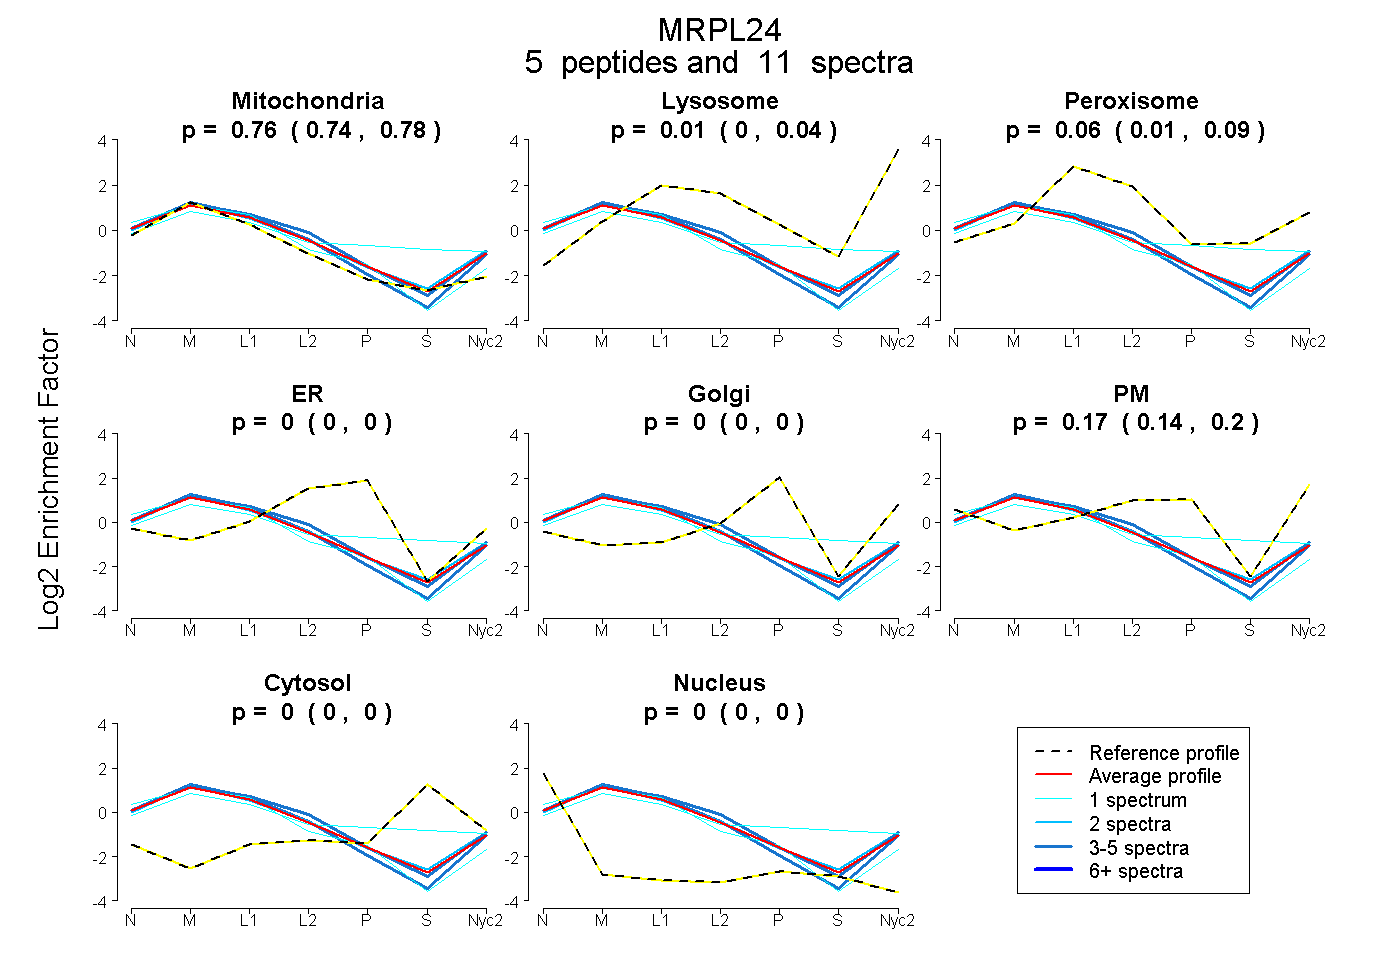
0.738 | 0.775
0.000 | 0.036
0.006 | 0.094
0.000 | 0.000
0.000 | 0.000
0.144 | 0.197
0.000 | 0.000
0.000 | 0.000
1peptide
spectra
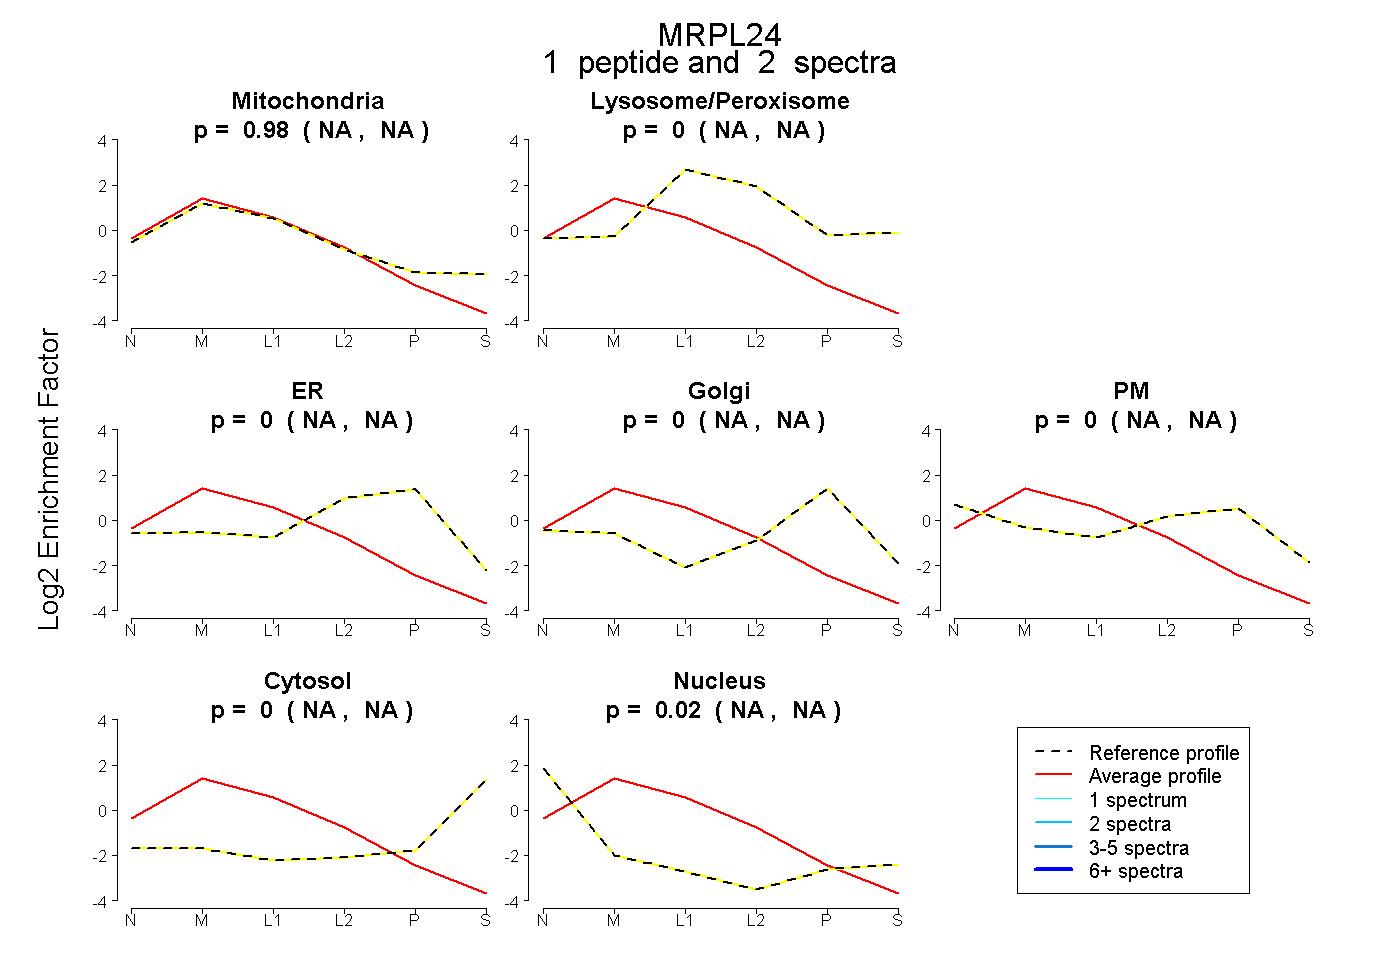
NA | NA
NA | NA
NA | NA
NA | NA
NA | NA
NA | NA
NA | NA
10peptides
spectra
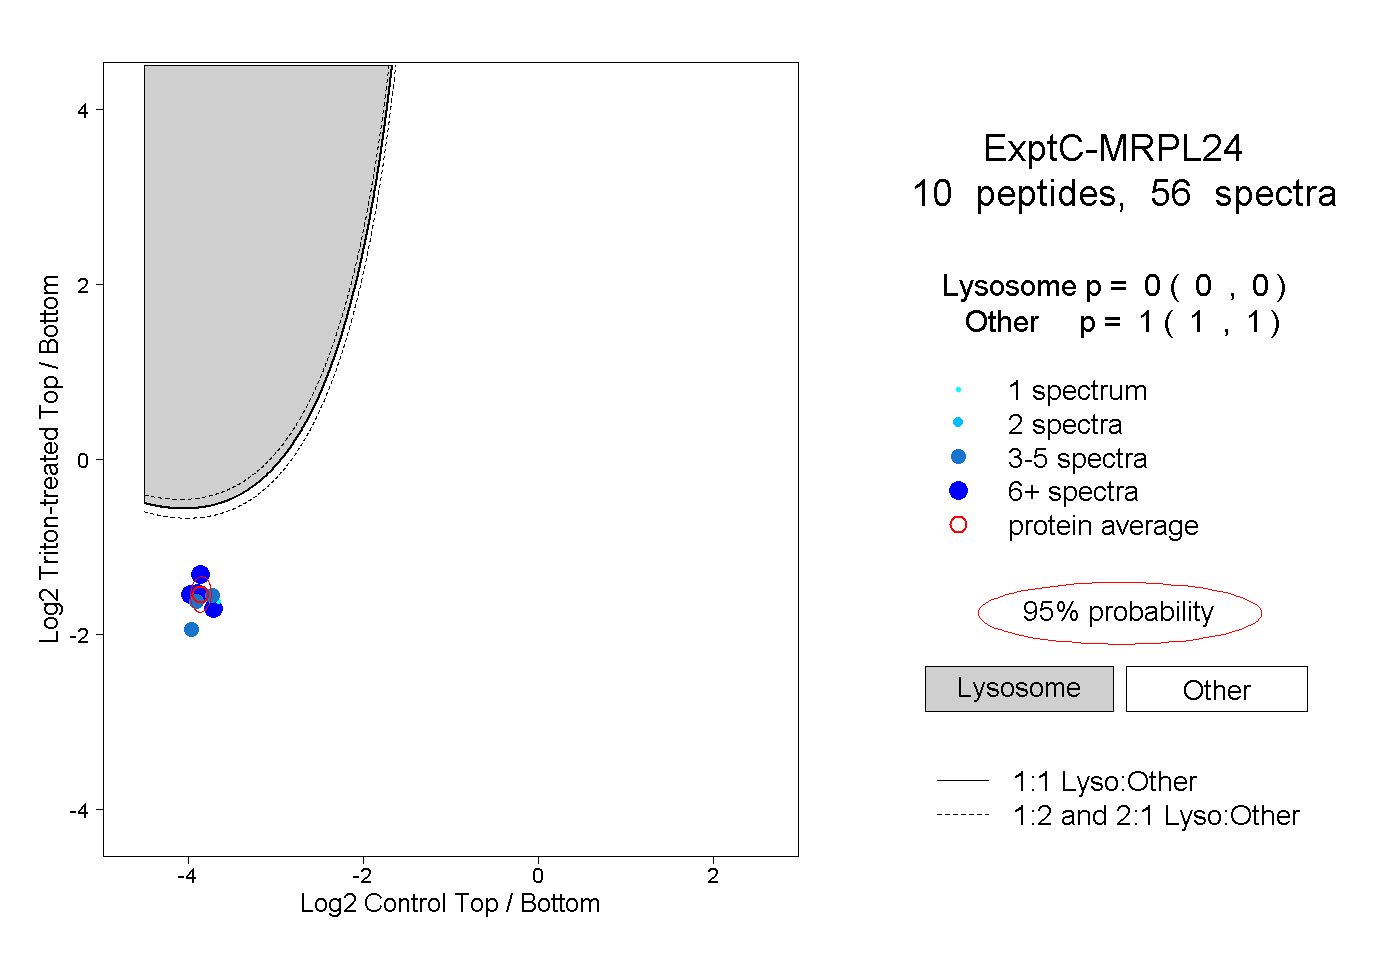
0.000 | 0.000
1.000 | 1.000
3peptides
spectra
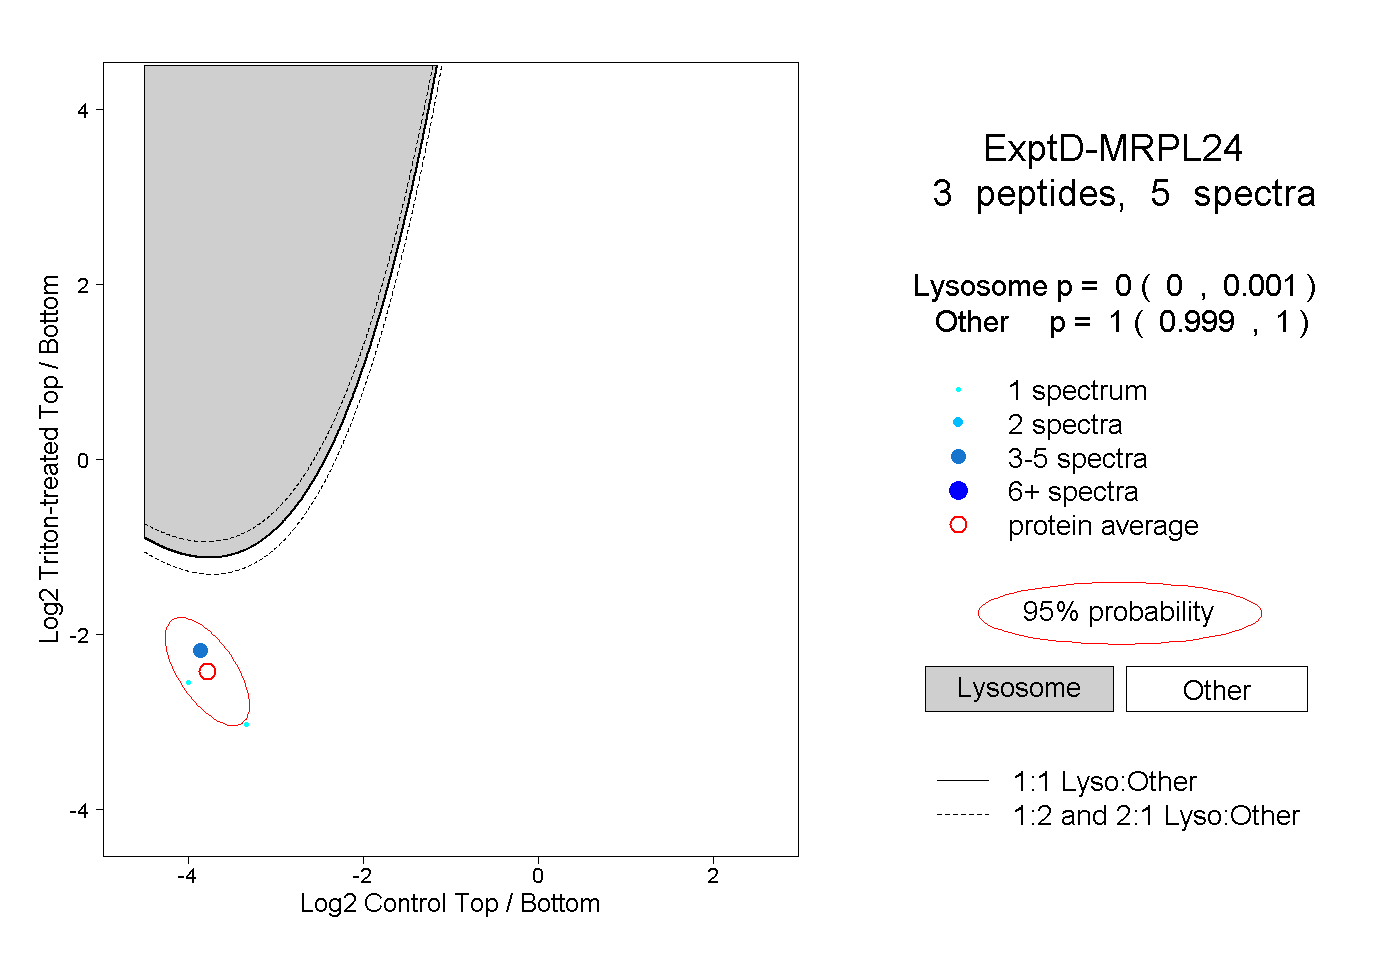
0.000 | 0.001
0.999 | 1.000