 5
5peptides
spectra
0.738 | 0.775
0.000 | 0.036
0.006 | 0.094
0.000 | 0.000
0.000 | 0.000
0.144 | 0.197
0.000 | 0.000
0.000 | 0.000
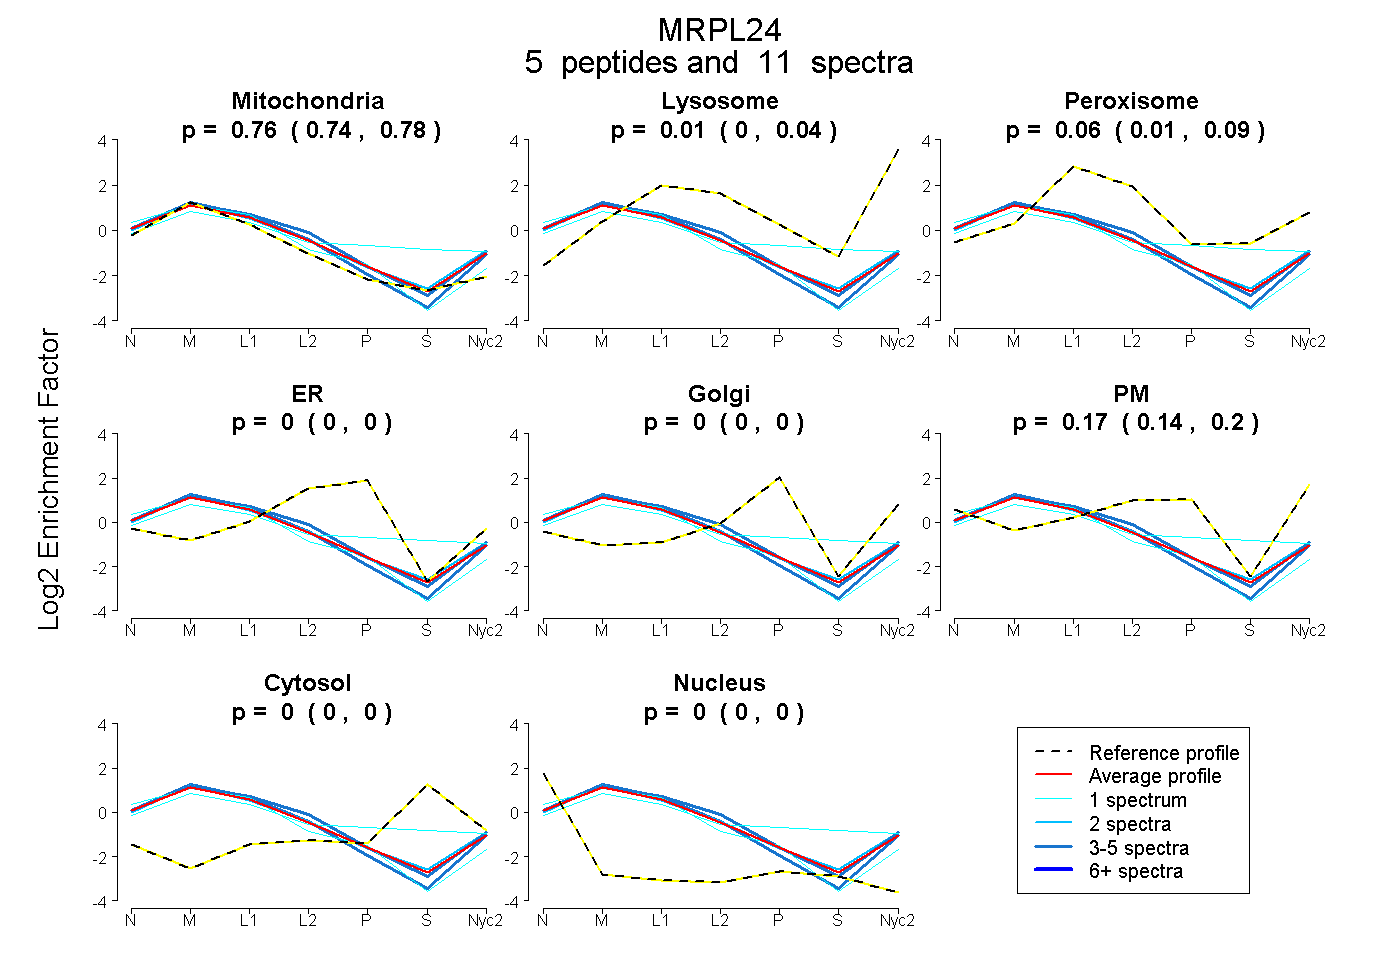
| Plot | Mito | Lyso | Perox | ER | Golgi | PM | Cytosol | Nucleus | |||||
| Expt A |
5 peptides |
11 spectra |
|
0.757 0.738 | 0.775 |
0.015 0.000 | 0.036 |
0.056 0.006 | 0.094 |
0.000 0.000 | 0.000 |
0.000 0.000 | 0.000 |
0.172 0.144 | 0.197 |
0.000 0.000 | 0.000 |
0.000 0.000 | 0.000 |
| 2 spectra, FTEAGER | 0.767 | 0.081 | 0.018 | 0.000 | 0.000 | 0.134 | 0.000 | 0.000 | ||
| 3 spectra, IIPKPEFPR | 0.720 | 0.018 | 0.091 | 0.000 | 0.000 | 0.171 | 0.000 | 0.000 | ||
| 4 spectra, DTSVEDALER | 0.819 | 0.034 | 0.000 | 0.000 | 0.000 | 0.147 | 0.000 | 0.000 | ||
| 1 spectrum, NWVVLEGLNTHYR | 0.479 | 0.000 | 0.233 | 0.000 | 0.127 | 0.000 | 0.161 | 0.000 | ||
| 1 spectrum, KPTEIQWR | 0.859 | 0.000 | 0.000 | 0.016 | 0.000 | 0.125 | 0.000 | 0.000 |
| Plot | Mito | Lyso or Perox | ER | Golgi | PM | Cytosol | Nucleus | ||||||
| Expt B |
1 peptide |
2 spectra |
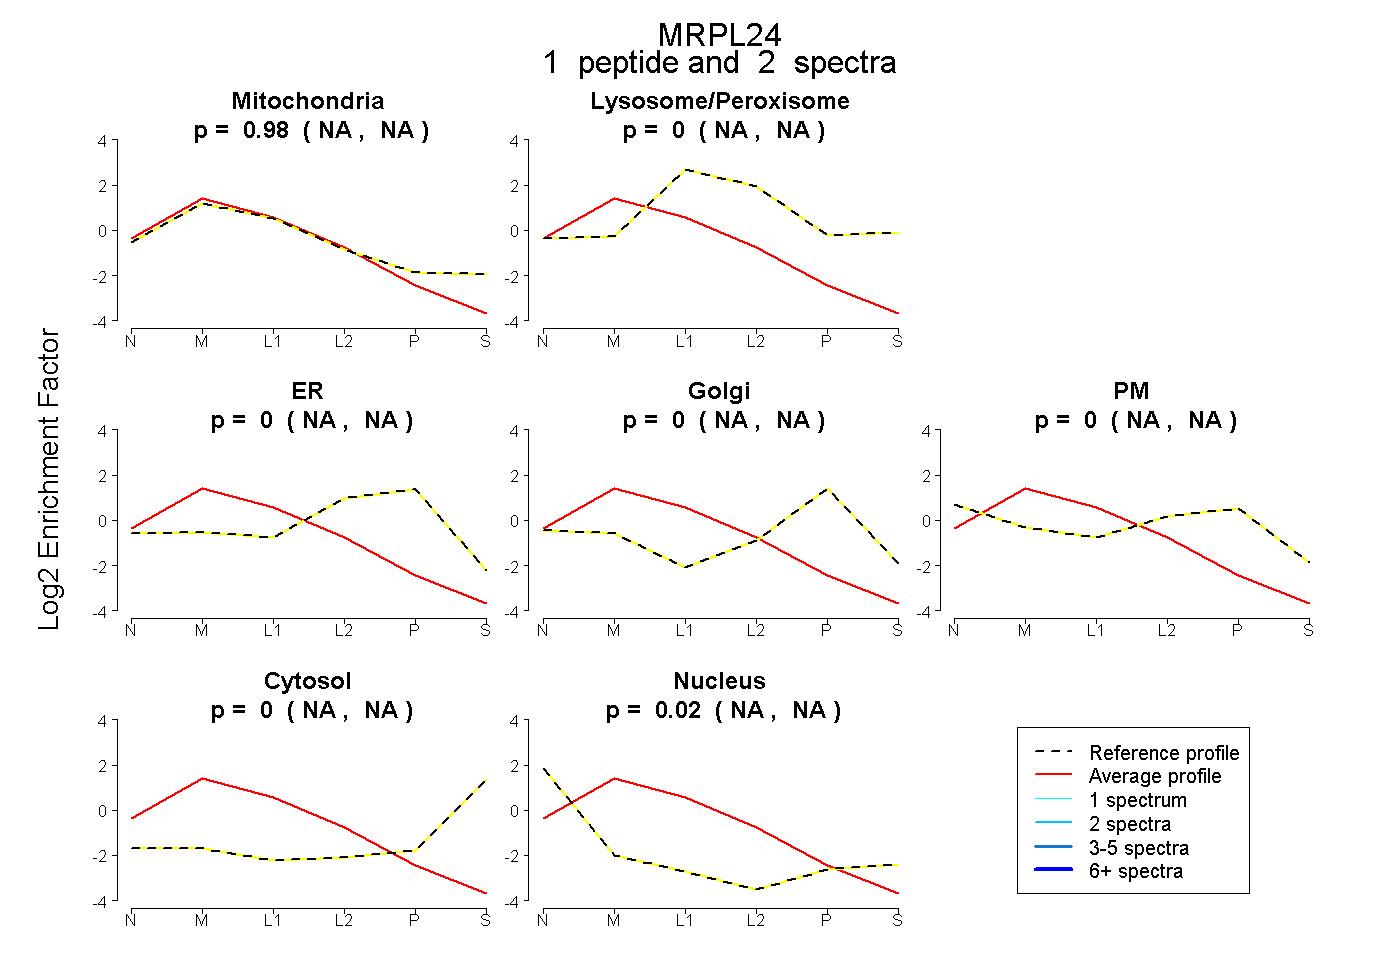 |
0.982 NA | NA |
0.000 NA | NA |
0.000 NA | NA |
0.000 NA | NA |
0.000 NA | NA |
0.000 NA | NA |
0.018 NA | NA |
|||
| Plot | Lyso | Other | |||||||||||
| Expt C |
10 peptides |
56 spectra |
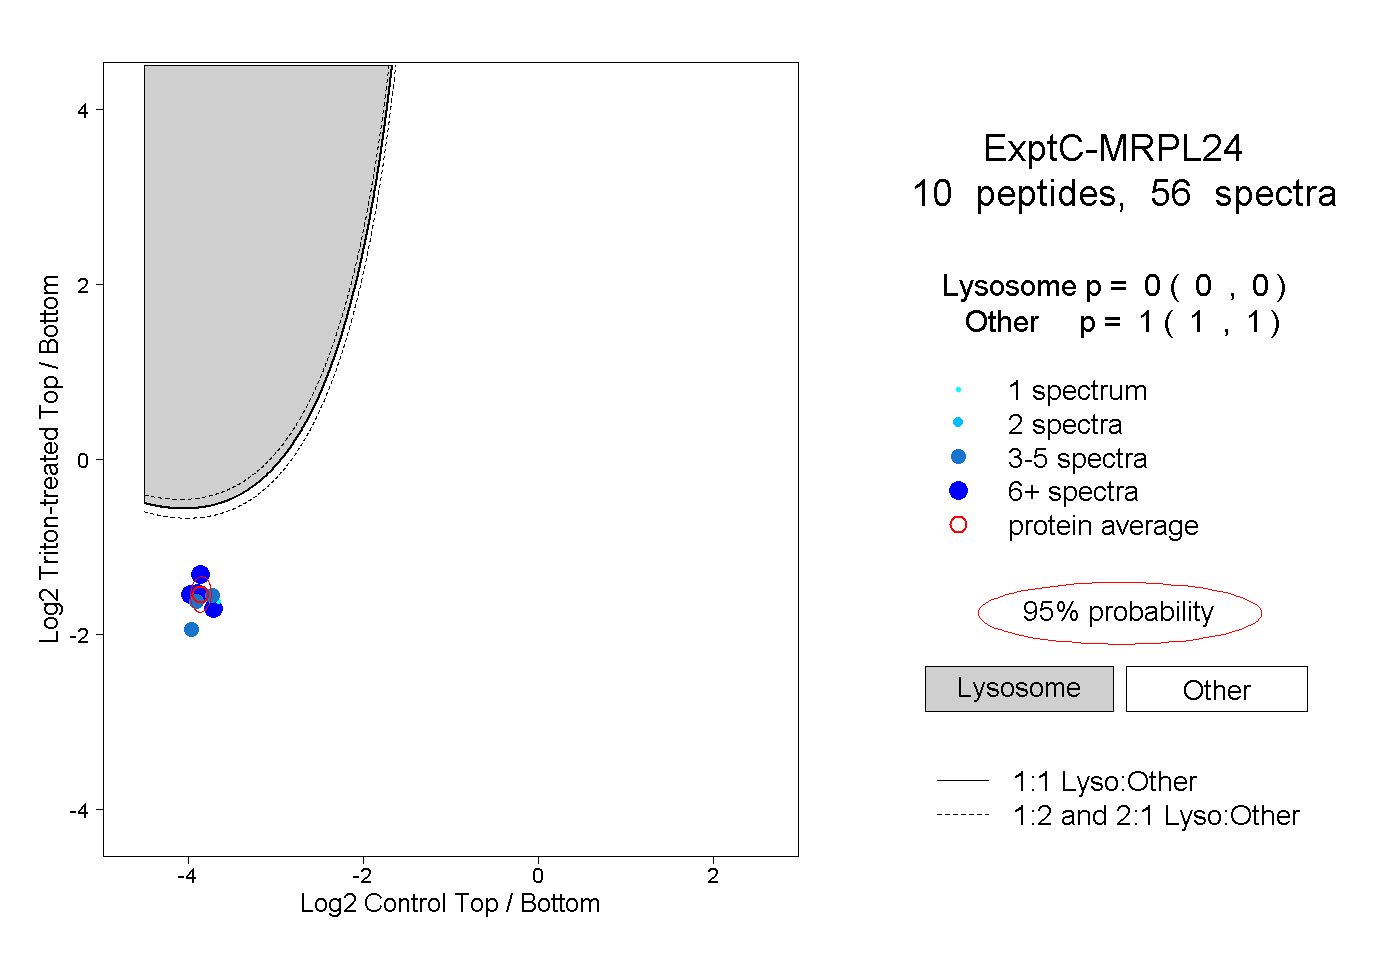 |
0.000 0.000 | 0.000 |
1.000 1.000 | 1.000 |
||||||||
| Plot | Lyso | Other | |||||||||||
| Expt D |
3 peptides |
5 spectra |
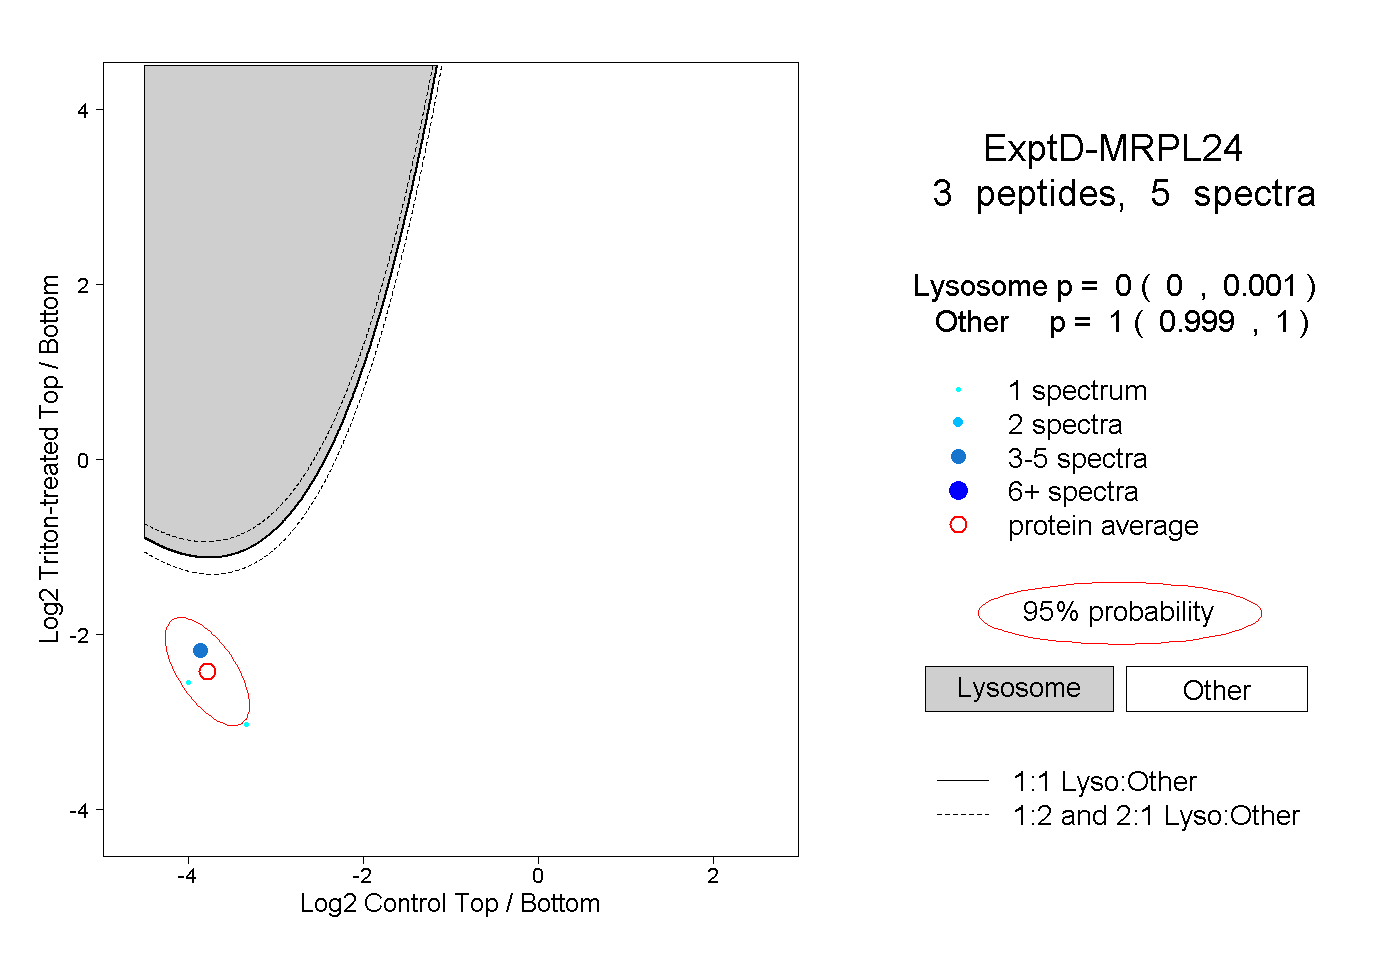 |
0.000 0.000 | 0.001 |
1.000 0.999 | 1.000 |