 3
3peptides
spectra
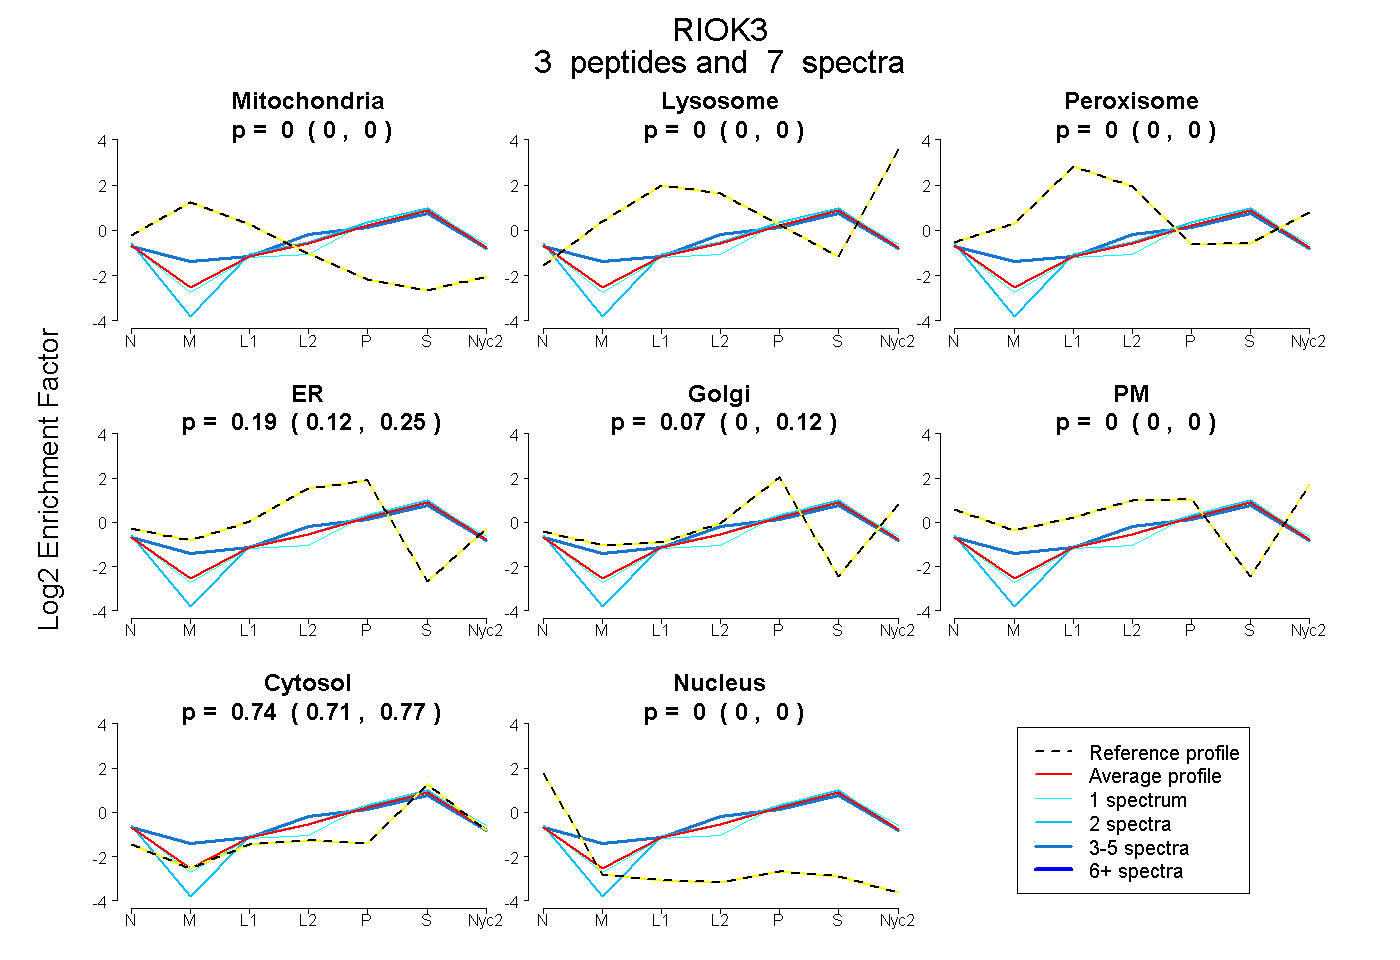
0.000 | 0.000
0.000 | 0.000
0.000 | 0.000
0.123 | 0.248
0.002 | 0.118
0.000 | 0.000
0.713 | 0.765
0.000 | 0.000
1peptide
spectrum
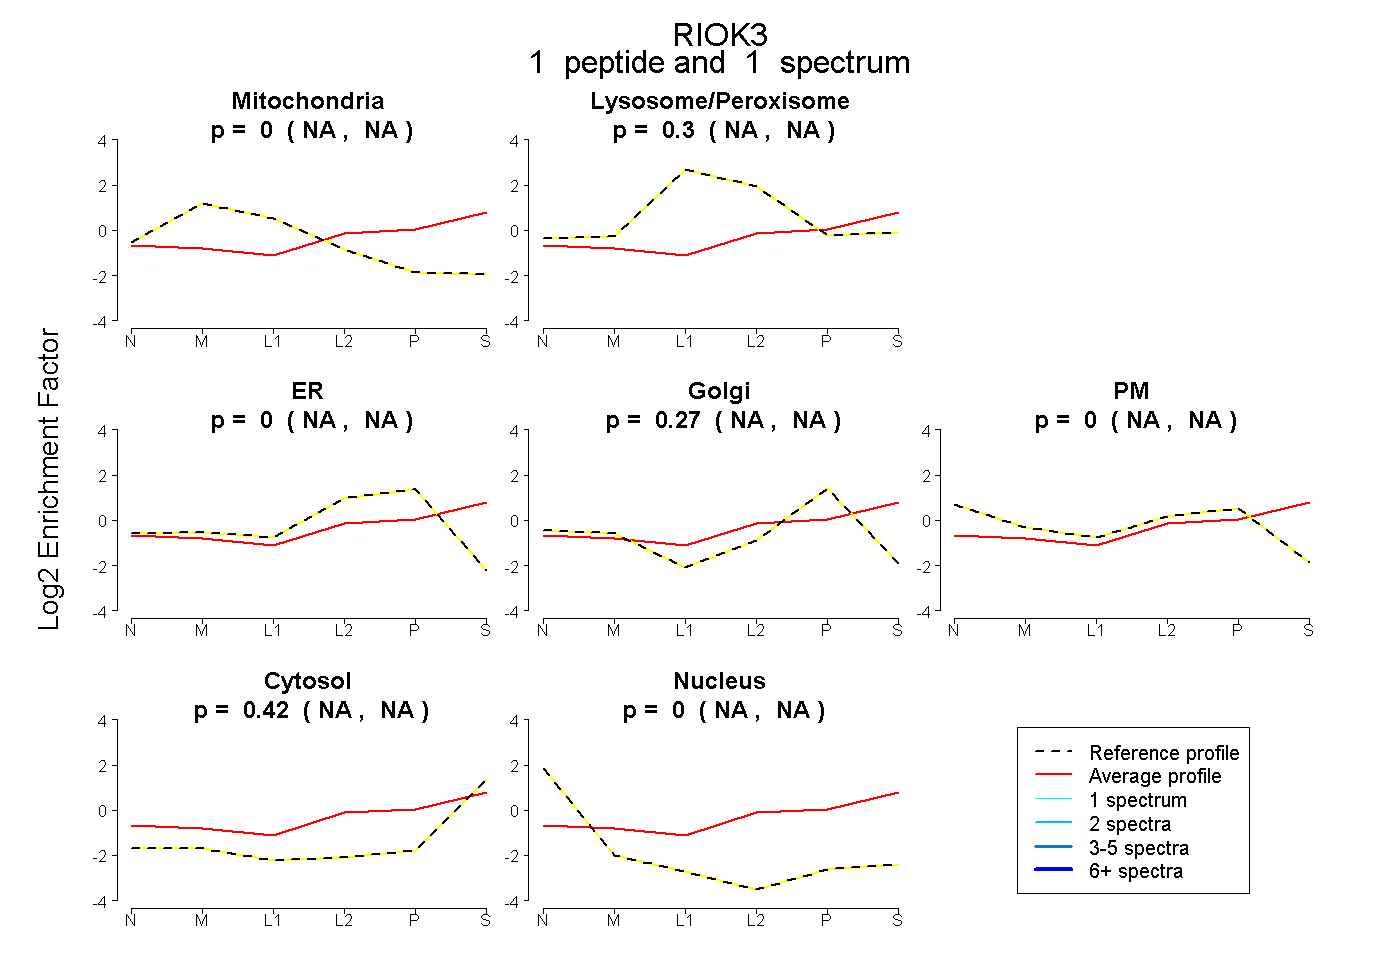
NA | NA
NA | NA
NA | NA
NA | NA
NA | NA
NA | NA
NA | NA
4peptides
spectra

0.000 | 0.000
1.000 | 1.000