 3
3peptides
spectra
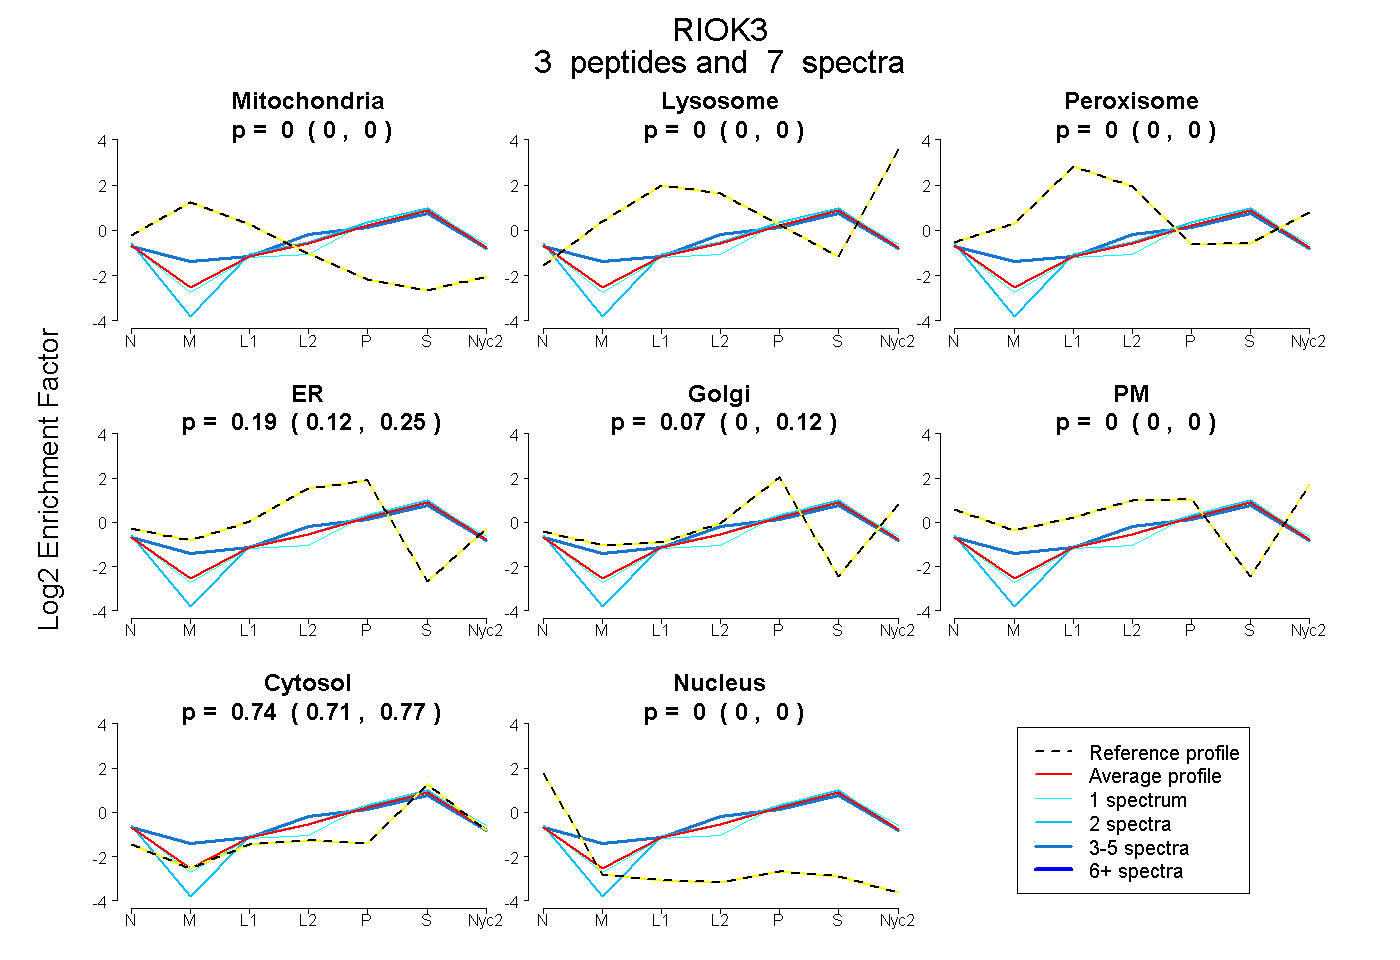
0.000 | 0.000
0.000 | 0.000
0.000 | 0.000
0.123 | 0.248
0.002 | 0.118
0.000 | 0.000
0.713 | 0.765
0.000 | 0.000
| Plot | Mito | Lyso | Perox | ER | Golgi | PM | Cytosol | Nucleus | |||||
| Expt A |
3 peptides |
7 spectra |
|
0.000 0.000 | 0.000 |
0.000 0.000 | 0.000 |
0.000 0.000 | 0.000 |
0.193 0.123 | 0.248 |
0.065 0.002 | 0.118 |
0.000 0.000 | 0.000 |
0.742 0.713 | 0.765 |
0.000 0.000 | 0.000 |
| 2 spectra, MNEDHVQK | 0.000 | 0.000 | 0.000 | 0.158 | 0.049 | 0.000 | 0.793 | 0.000 | ||
| 4 spectra, HDEVVCGR | 0.000 | 0.000 | 0.017 | 0.313 | 0.000 | 0.000 | 0.670 | 0.000 | ||
| 1 spectrum, TTLNEFK | 0.000 | 0.000 | 0.000 | 0.000 | 0.254 | 0.000 | 0.746 | 0.000 |
| Plot | Mito | Lyso or Perox | ER | Golgi | PM | Cytosol | Nucleus | ||||||
| Expt B |
1 peptide |
1 spectrum |
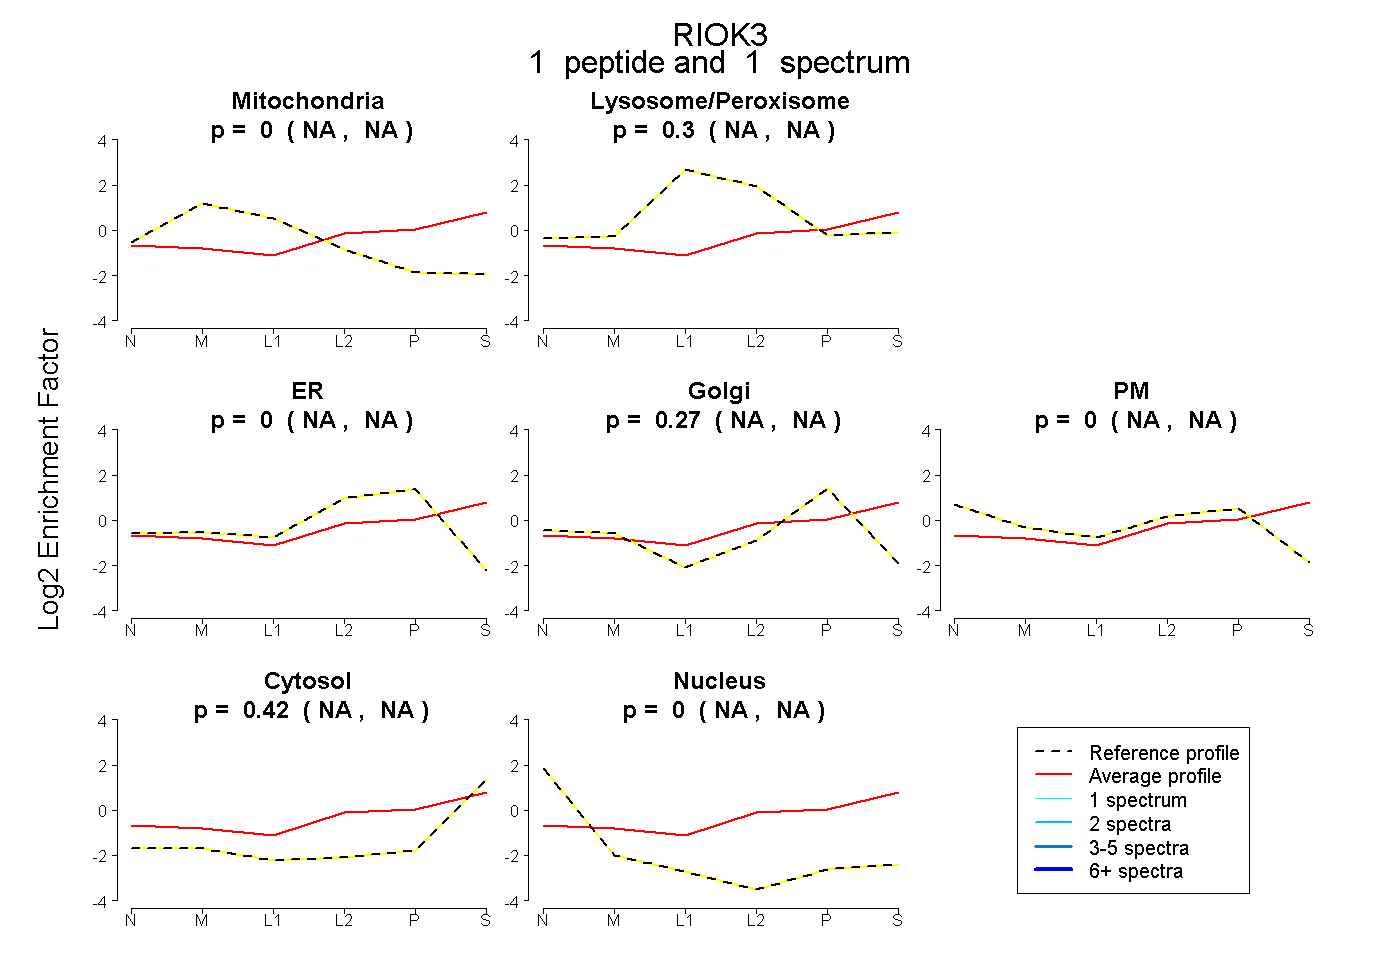 |
0.000 NA | NA |
0.301 NA | NA |
0.000 NA | NA |
0.275 NA | NA |
0.000 NA | NA |
0.424 NA | NA |
0.000 NA | NA |
|||
| Plot | Lyso | Other | |||||||||||
| Expt C |
4 peptides |
6 spectra |
 |
0.000 0.000 | 0.000 |
1.000 1.000 | 1.000 |