 13
13peptides
spectra
0.000 | 0.000
0.000 | 0.000
0.000 | 0.000
0.068 | 0.152
0.042 | 0.140
0.000 | 0.000
0.201 | 0.223
0.564 | 0.589
1peptide
spectrum
NA | NA
NA | NA
NA | NA
NA | NA
NA | NA
NA | NA
NA | NA
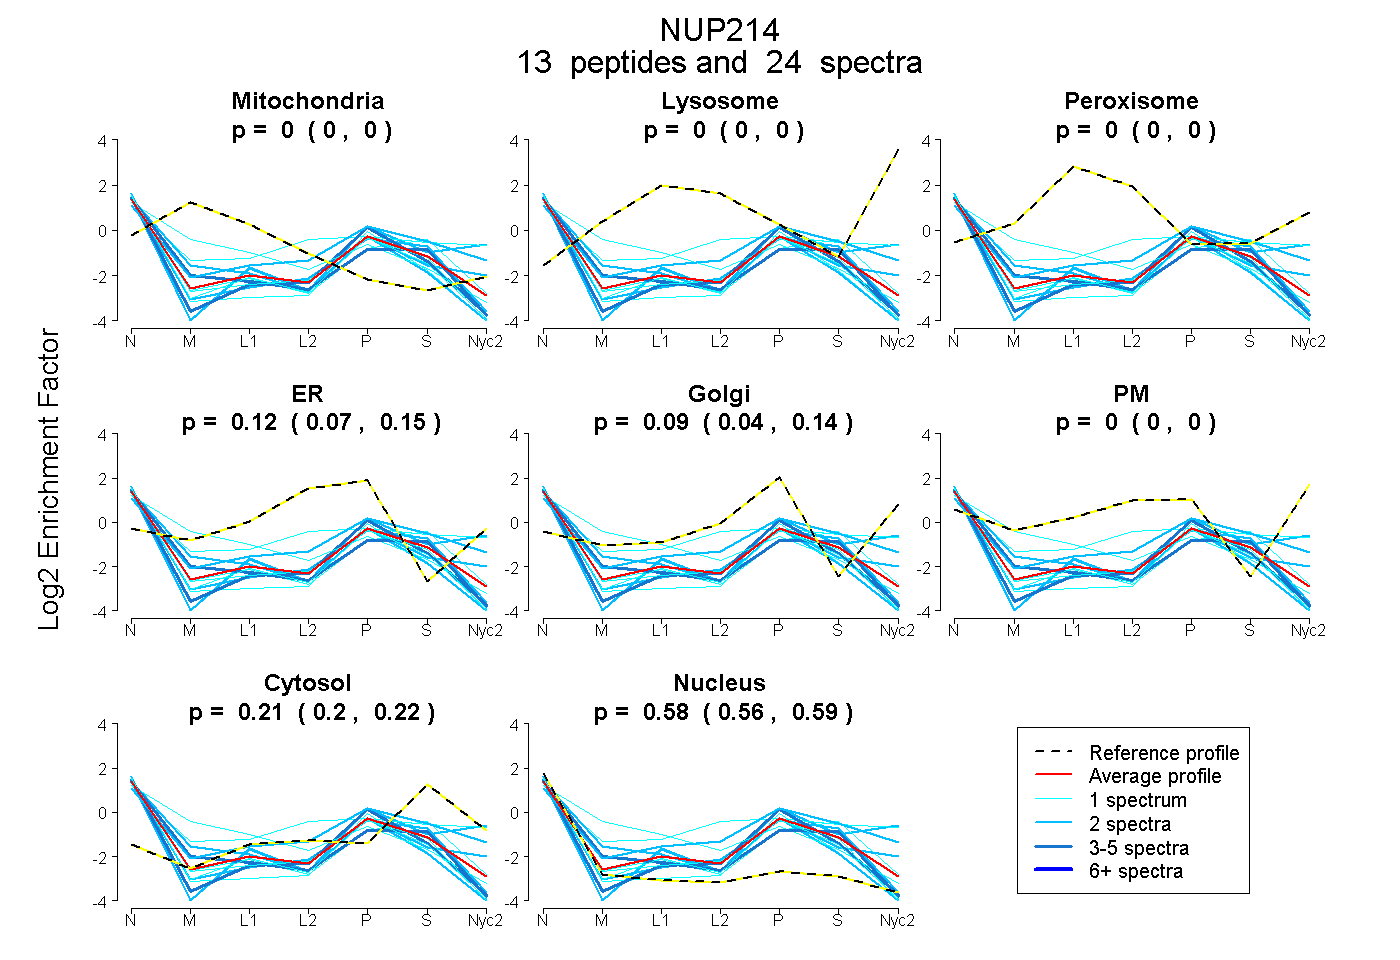
| Plot | Mito | Lyso | Perox | ER | Golgi | PM | Cytosol | Nucleus | |||||
| Expt A |
13 peptides |
24 spectra |
|
0.000 0.000 | 0.000 |
0.000 0.000 | 0.000 |
0.000 0.000 | 0.000 |
0.115 0.068 | 0.152 |
0.093 0.042 | 0.140 |
0.000 0.000 | 0.000 |
0.214 0.201 | 0.223 |
0.578 0.564 | 0.589 |
||
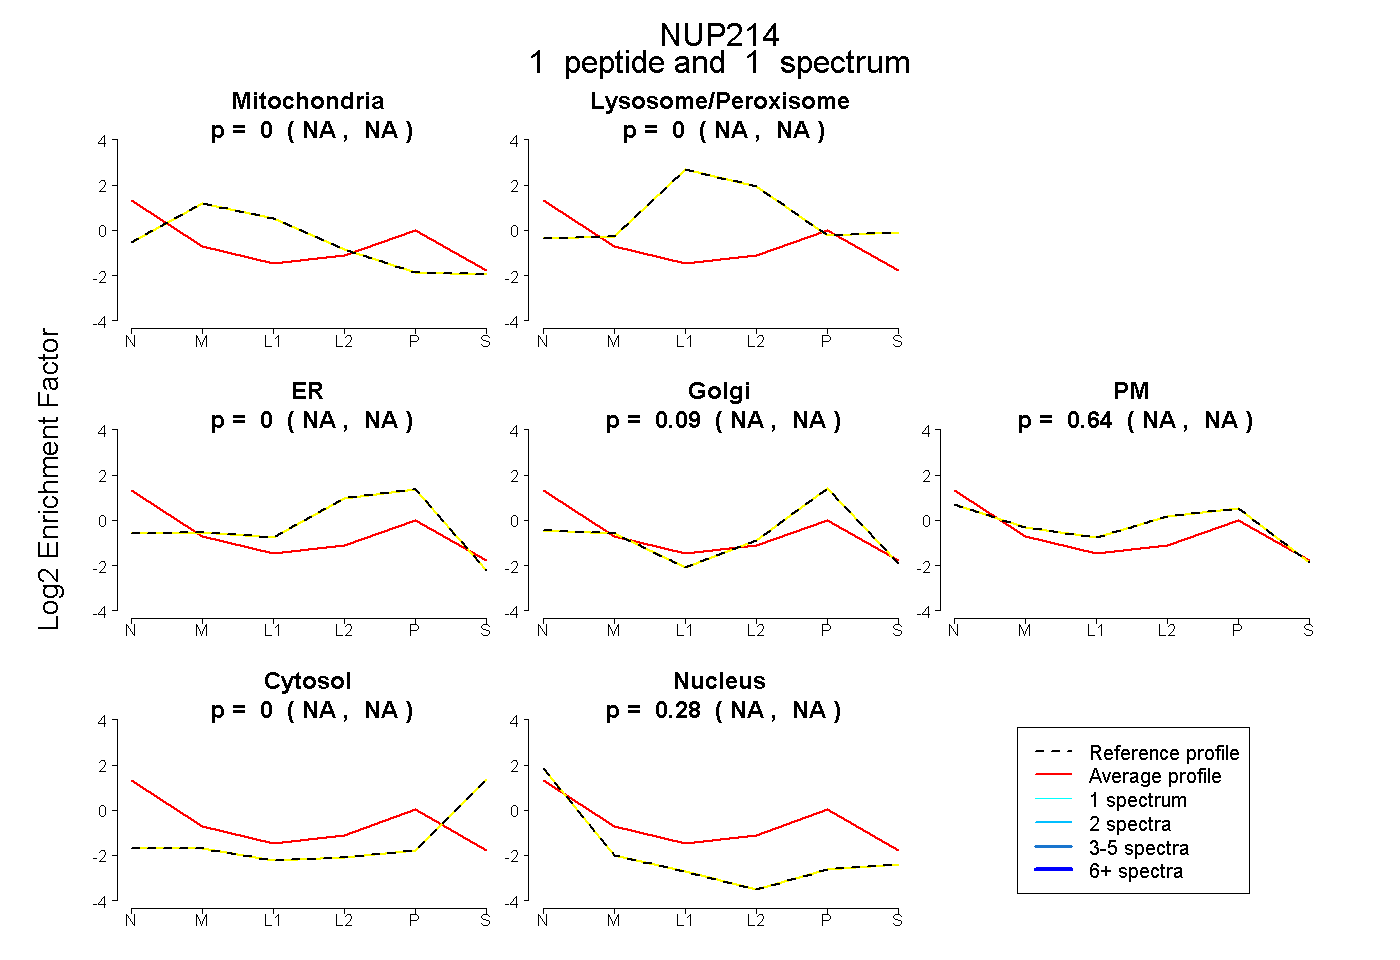
| Plot | Mito | Lyso or Perox | ER | Golgi | PM | Cytosol | Nucleus | ||||||
| Expt B |
1 peptide |
1 spectrum |
|
0.000 NA | NA |
0.000 NA | NA |
0.000 NA | NA |
0.085 NA | NA |
0.636 NA | NA |
0.000 NA | NA |
0.279 NA | NA |