 16
16peptides
spectra
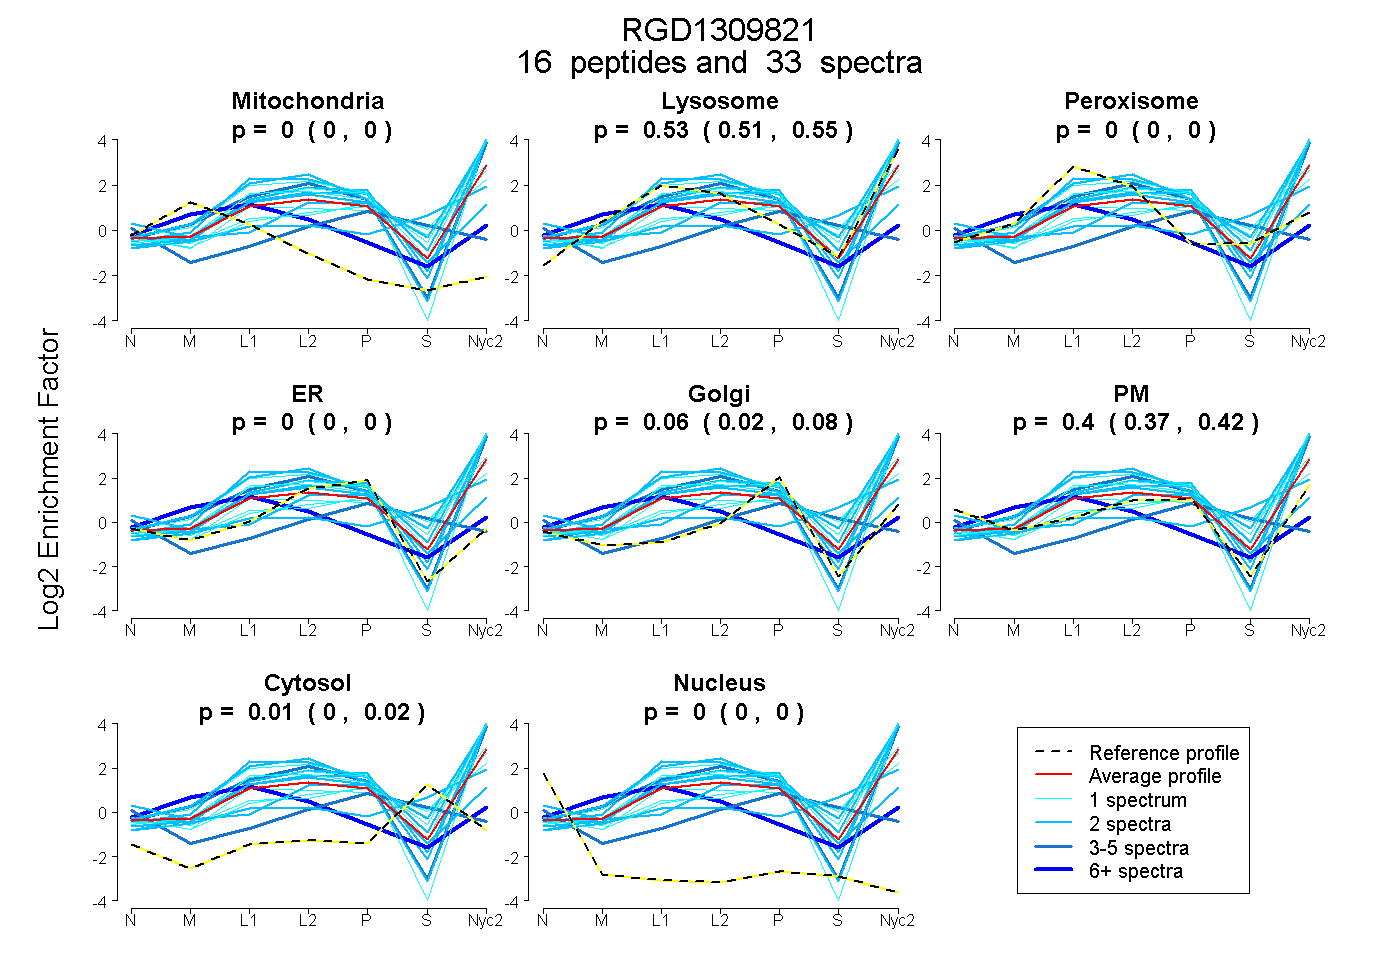
0.000 | 0.000
0.513 | 0.552
0.000 | 0.000
0.000 | 0.000
0.022 | 0.081
0.369 | 0.425
0.000 | 0.023
0.000 | 0.000
2peptides
spectra
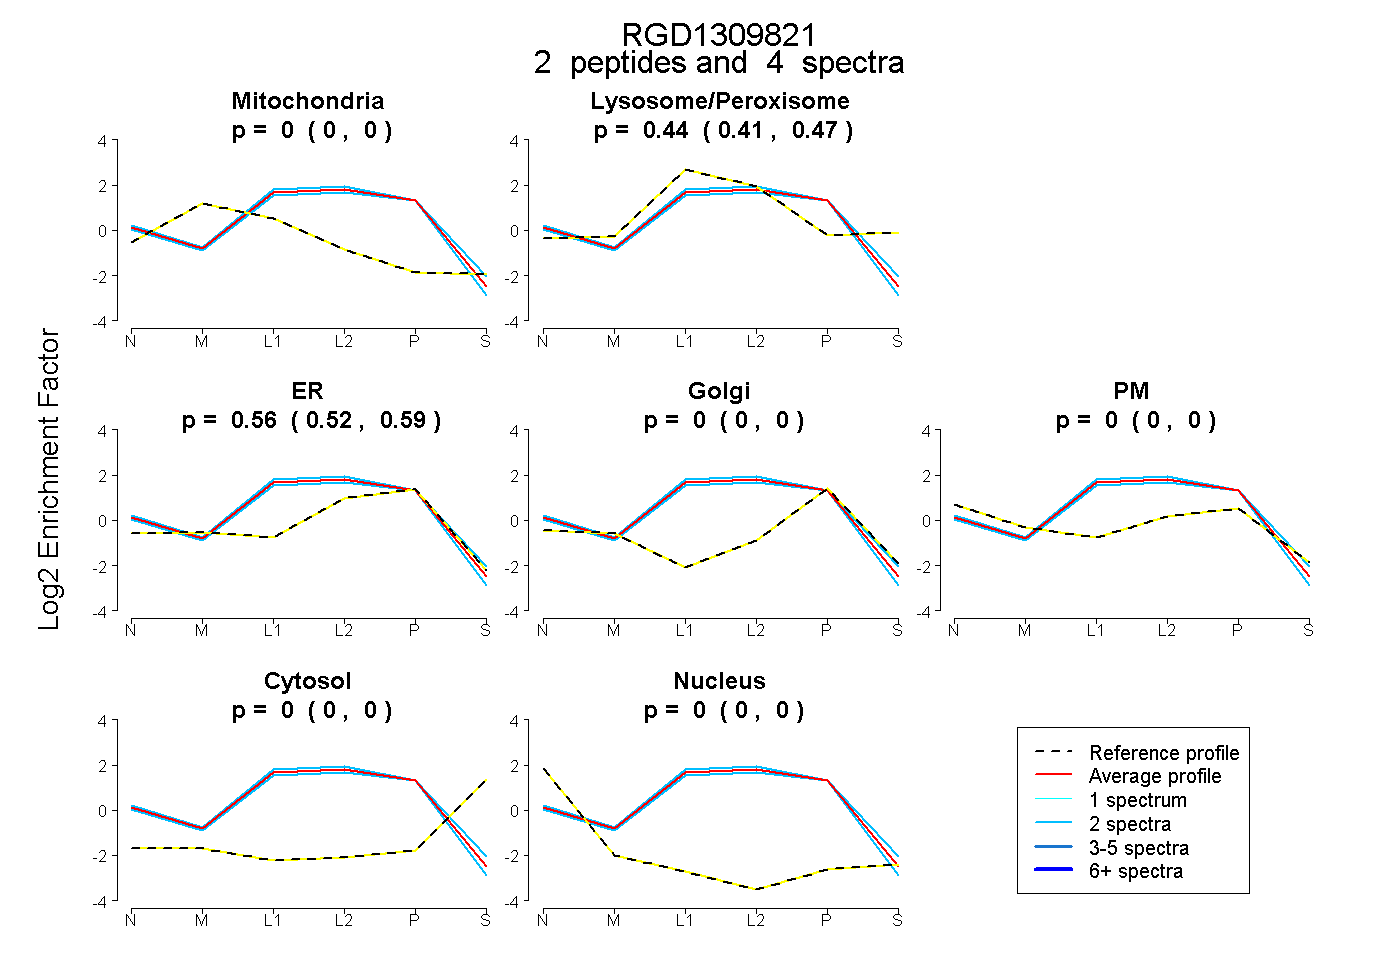
0.000 | 0.000
0.406 | 0.475
0.521 | 0.590
0.000 | 0.000
0.000 | 0.000
0.000 | 0.000
0.000 | 0.000
20peptides
spectra

0.955 | 1.000
0.000 | 0.045
5peptides
spectra
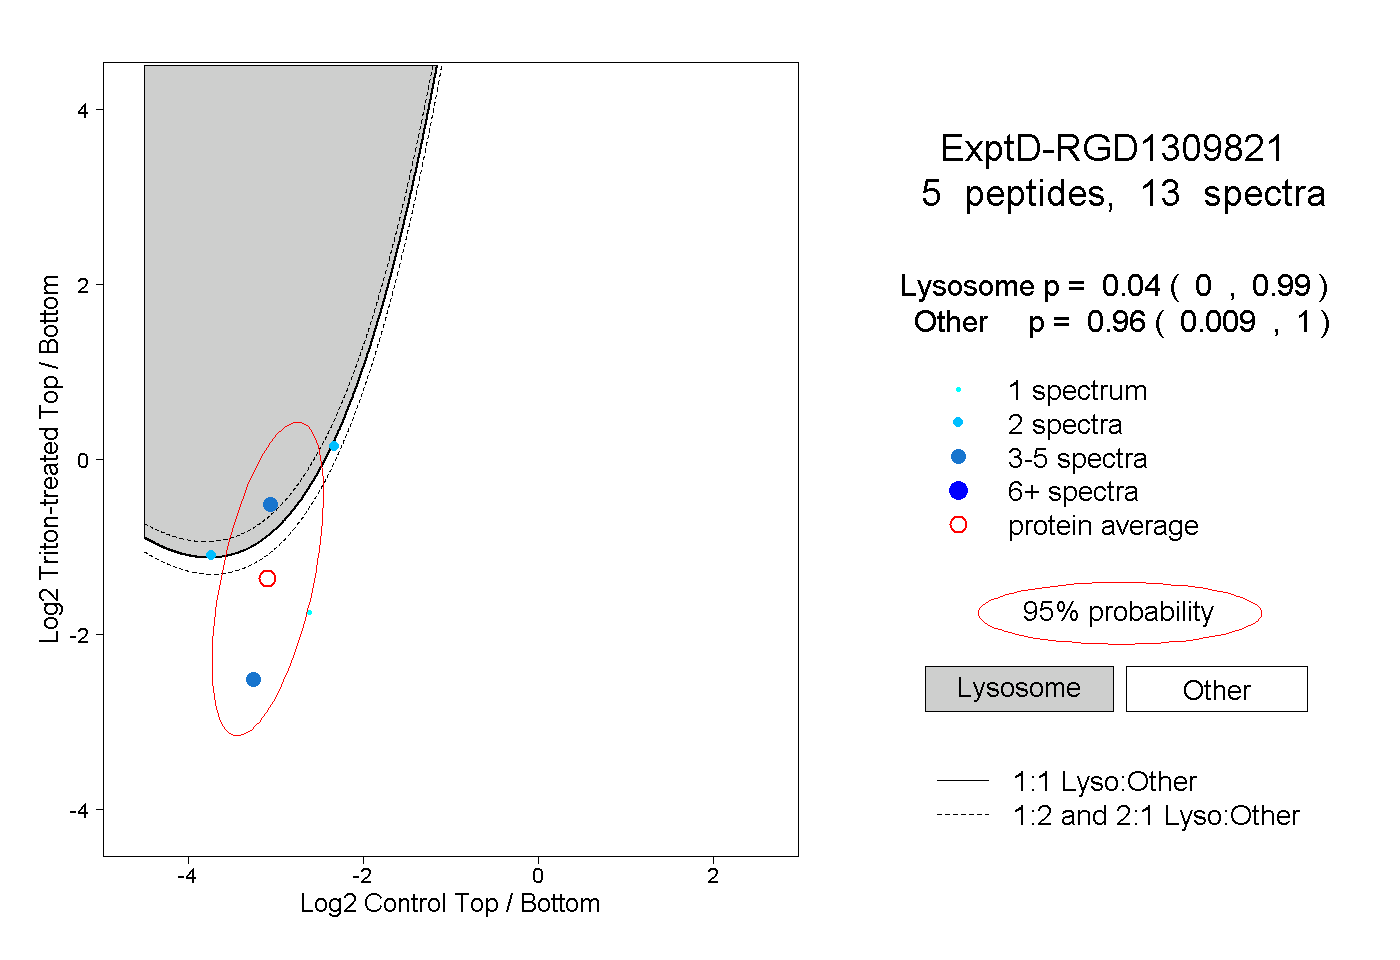
0.000 | 0.990
0.009 | 1.000