 16
16peptides
spectra
0.000 | 0.000
0.513 | 0.552
0.000 | 0.000
0.000 | 0.000
0.022 | 0.081
0.369 | 0.425
0.000 | 0.023
0.000 | 0.000
| Plot | Mito | Lyso | Perox | ER | Golgi | PM | Cytosol | Nucleus | |||||
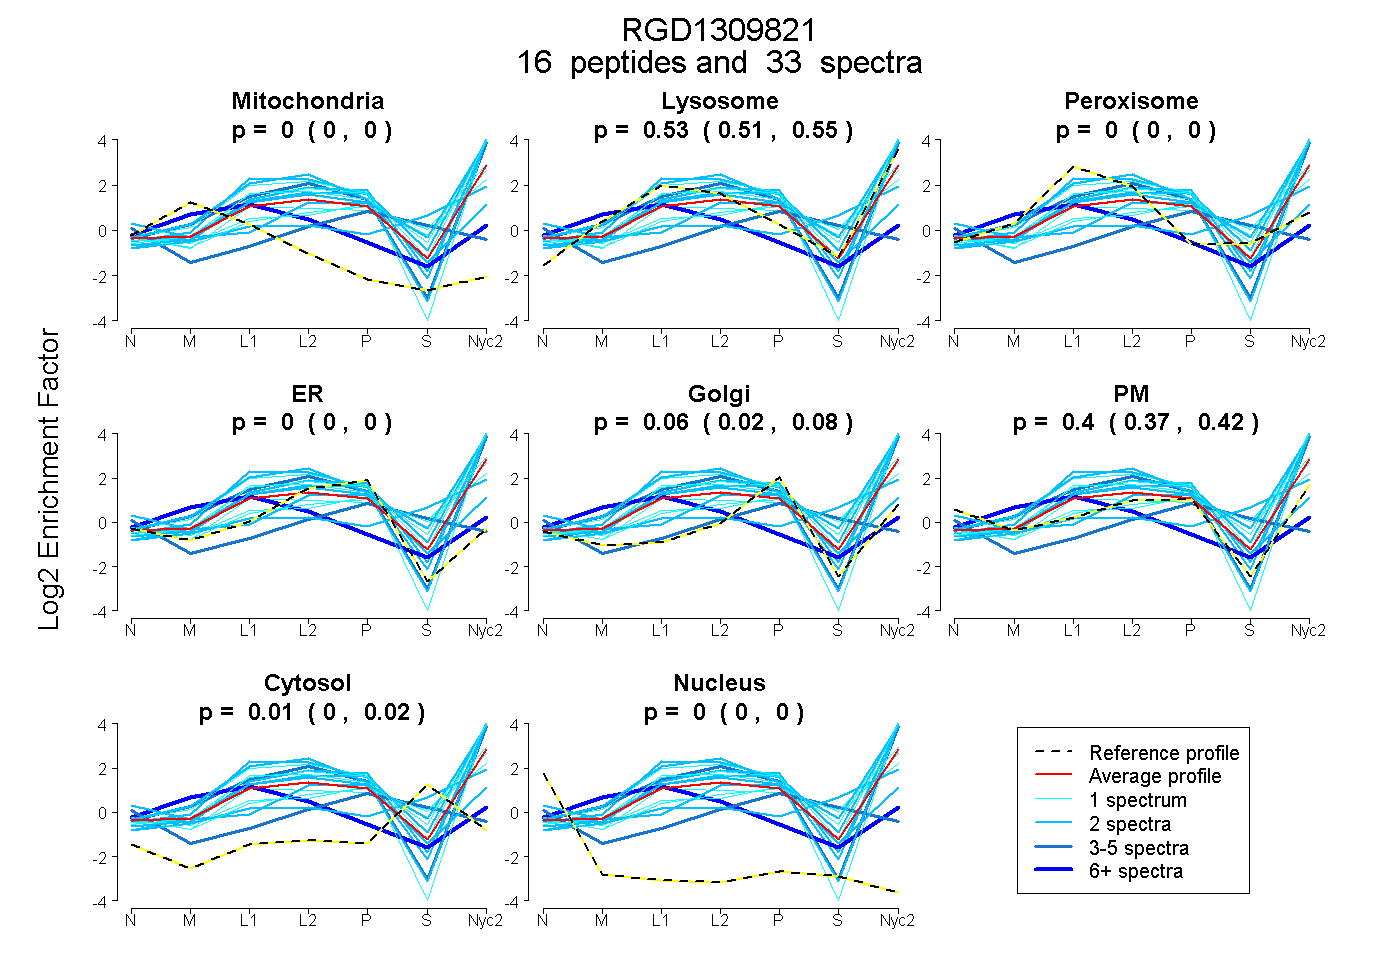
| Expt A |
16 peptides |
33 spectra |
|
0.000 0.000 | 0.000 |
0.535 0.513 | 0.552 |
0.000 0.000 | 0.000 |
0.000 0.000 | 0.000 |
0.056 0.022 | 0.081 |
0.400 0.369 | 0.425 |
0.010 0.000 | 0.023 |
0.000 0.000 | 0.000 |
| 2 spectra, VLQFAQQIR | 0.000 | 0.676 | 0.000 | 0.000 | 0.000 | 0.324 | 0.000 | 0.000 | ||
| 1 spectrum, SVDQNK | 0.000 | 0.483 | 0.000 | 0.000 | 0.135 | 0.222 | 0.160 | 0.000 | ||
| 1 spectrum, DTVMCYR | 0.000 | 0.471 | 0.069 | 0.000 | 0.000 | 0.242 | 0.217 | 0.000 | ||
| 2 spectra, TAGRPDGPGPER | 0.000 | 0.039 | 0.038 | 0.188 | 0.000 | 0.635 | 0.101 | 0.000 | ||
| 2 spectra, FGEGVER | 0.000 | 0.617 | 0.000 | 0.000 | 0.000 | 0.383 | 0.000 | 0.000 | ||
| 2 spectra, TQHWPIR | 0.000 | 0.539 | 0.000 | 0.000 | 0.000 | 0.022 | 0.440 | 0.000 | ||
| 2 spectra, AELLDLNR | 0.000 | 0.781 | 0.000 | 0.000 | 0.000 | 0.219 | 0.000 | 0.000 | ||
| 1 spectrum, YFNKPSR | 0.000 | 0.756 | 0.000 | 0.000 | 0.000 | 0.244 | 0.000 | 0.000 | ||
| 3 spectra, EWFQGHLR | 0.000 | 0.592 | 0.000 | 0.000 | 0.000 | 0.408 | 0.000 | 0.000 | ||
| 1 spectrum, LPALVR | 0.000 | 0.548 | 0.000 | 0.000 | 0.000 | 0.452 | 0.000 | 0.000 | ||
| 1 spectrum, VPASEAFR | 0.000 | 0.531 | 0.000 | 0.000 | 0.094 | 0.183 | 0.192 | 0.000 | ||
| 7 spectra, GGFSIR | 0.359 | 0.099 | 0.320 | 0.000 | 0.045 | 0.176 | 0.000 | 0.000 | ||
| 3 spectra, SQVYPR | 0.000 | 0.000 | 0.000 | 0.350 | 0.000 | 0.157 | 0.492 | 0.000 | ||
| 2 spectra, GELFDK | 0.000 | 0.805 | 0.000 | 0.000 | 0.141 | 0.054 | 0.000 | 0.000 | ||
| 1 spectrum, TAAPELSYR | 0.000 | 0.812 | 0.000 | 0.000 | 0.000 | 0.188 | 0.000 | 0.000 | ||
| 2 spectra, WEEAAPGR | 0.000 | 0.829 | 0.000 | 0.000 | 0.093 | 0.066 | 0.012 | 0.000 |
| Plot | Mito | Lyso or Perox | ER | Golgi | PM | Cytosol | Nucleus | ||||||
| Expt B |
2 peptides |
4 spectra |
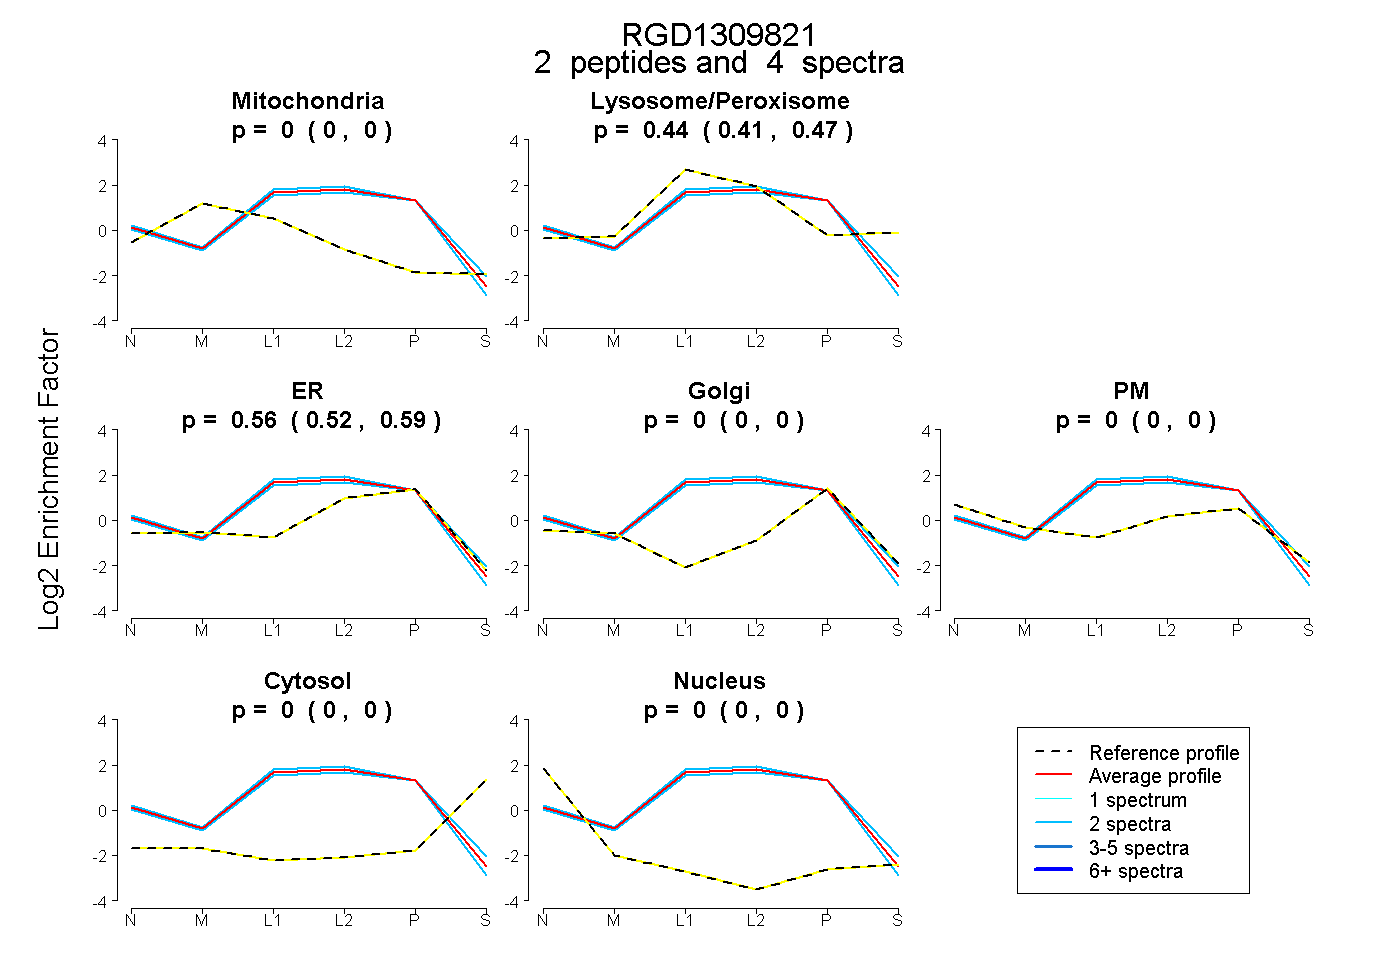 |
0.000 0.000 | 0.000 |
0.442 0.406 | 0.475 |
0.558 0.521 | 0.590 |
0.000 0.000 | 0.000 |
0.000 0.000 | 0.000 |
0.000 0.000 | 0.000 |
0.000 0.000 | 0.000 |
|||
| Plot | Lyso | Other | |||||||||||
| Expt C |
20 peptides |
109 spectra |
 |
1.000 0.955 | 1.000 |
0.000 0.000 | 0.045 |
||||||||
| Plot | Lyso | Other | |||||||||||
| Expt D |
5 peptides |
13 spectra |
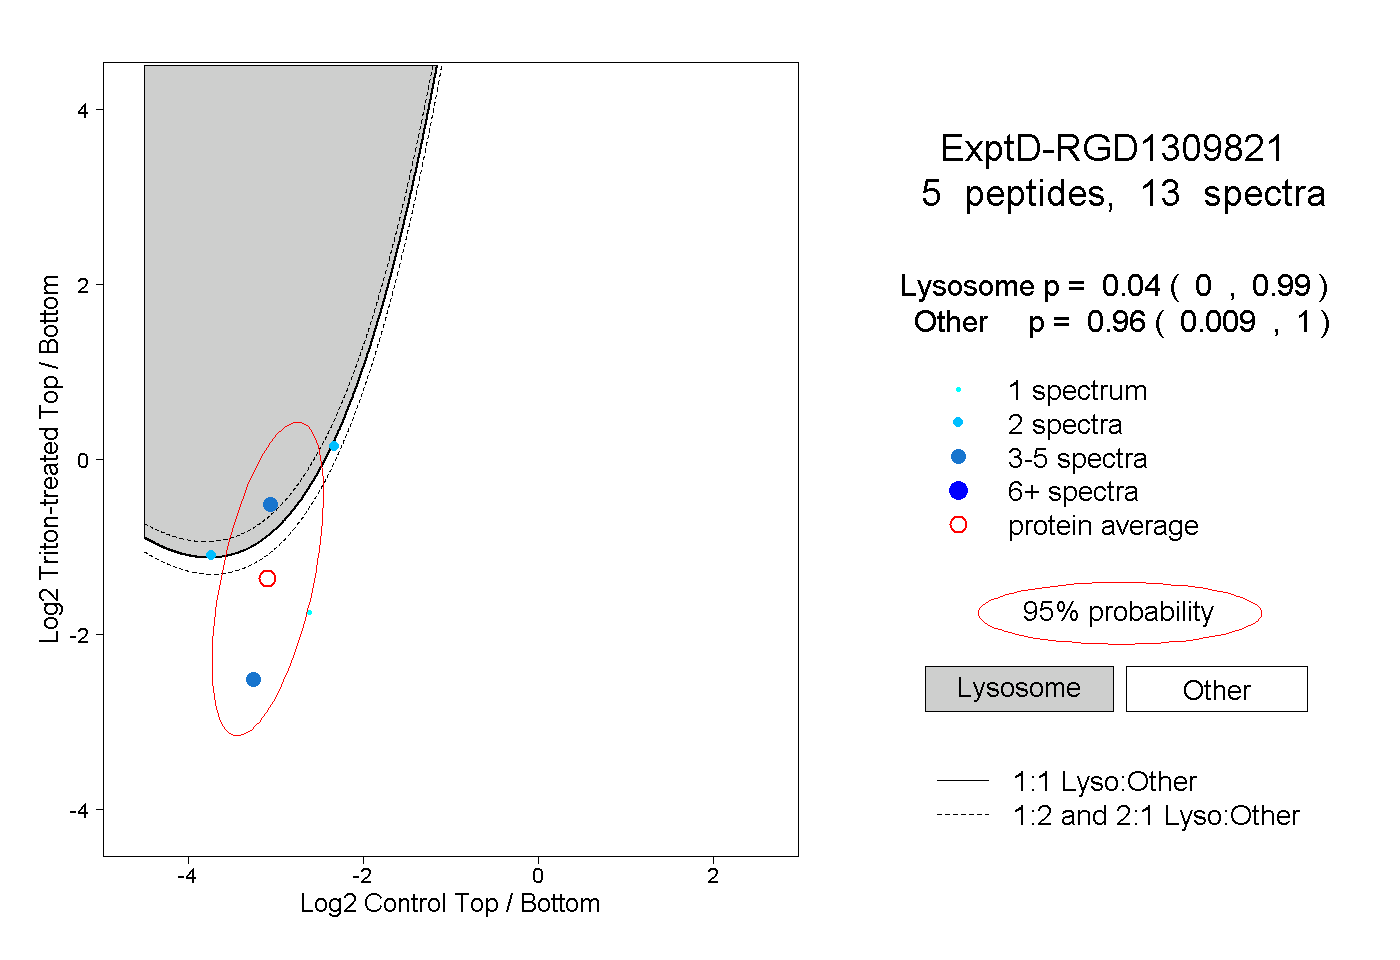 |
0.040 0.000 | 0.990 |
0.960 0.009 | 1.000 |