 8
8peptides
spectra
0.000 | 0.019
0.000 | 0.000
0.000 | 0.000
0.000 | 0.000
0.000 | 0.000
0.294 | 0.311
0.447 | 0.455
0.229 | 0.245
2peptides
spectra
0.000 | 0.000
1.000 | 1.000
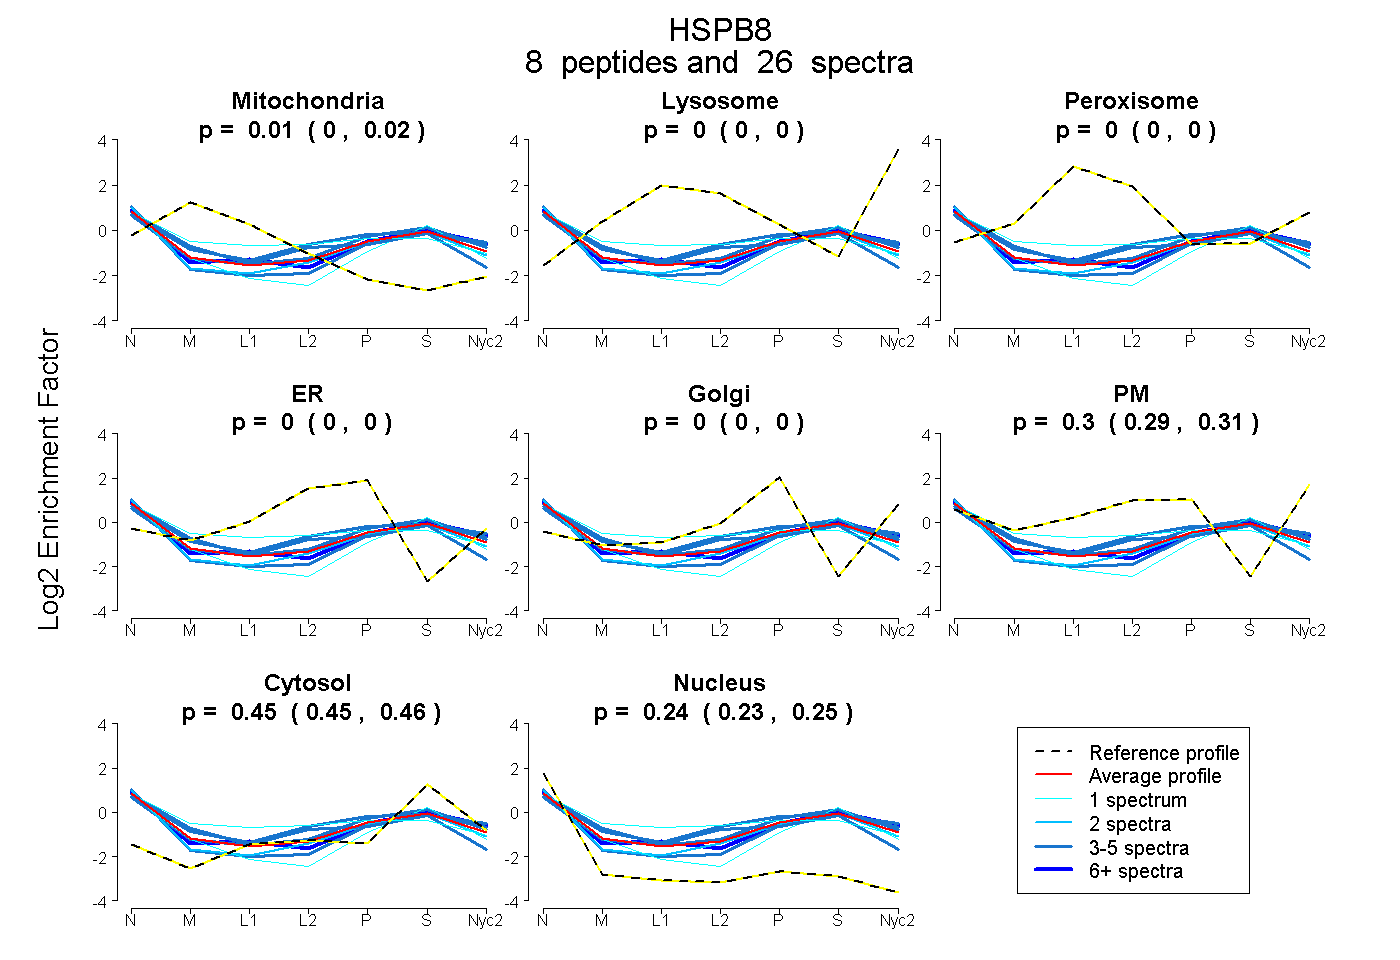
| Plot | Mito | Lyso | Perox | ER | Golgi | PM | Cytosol | Nucleus | |||||
| Expt A |
8 peptides |
26 spectra |
|
0.008 0.000 | 0.019 |
0.000 0.000 | 0.000 |
0.000 0.000 | 0.000 |
0.000 0.000 | 0.000 |
0.000 0.000 | 0.000 |
0.303 0.294 | 0.311 |
0.452 0.447 | 0.455 |
0.238 0.229 | 0.245 |
||
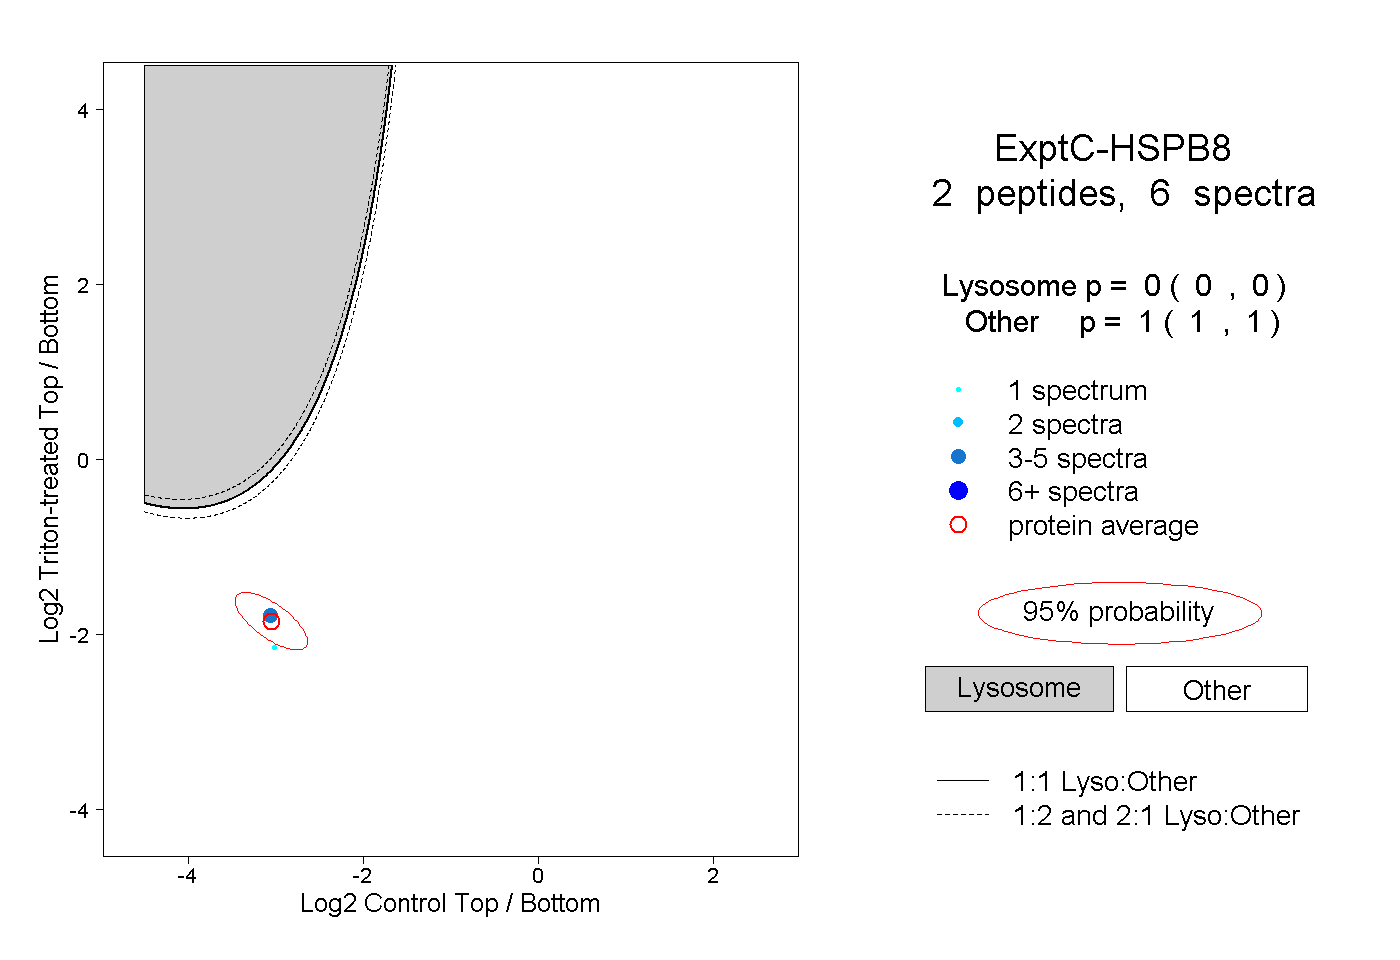
| Plot | Lyso | Other | |||||||||||
| Expt C |
2 peptides |
6 spectra |
|
0.000 0.000 | 0.000 |
1.000 1.000 | 1.000 |