 8
8peptides
spectra
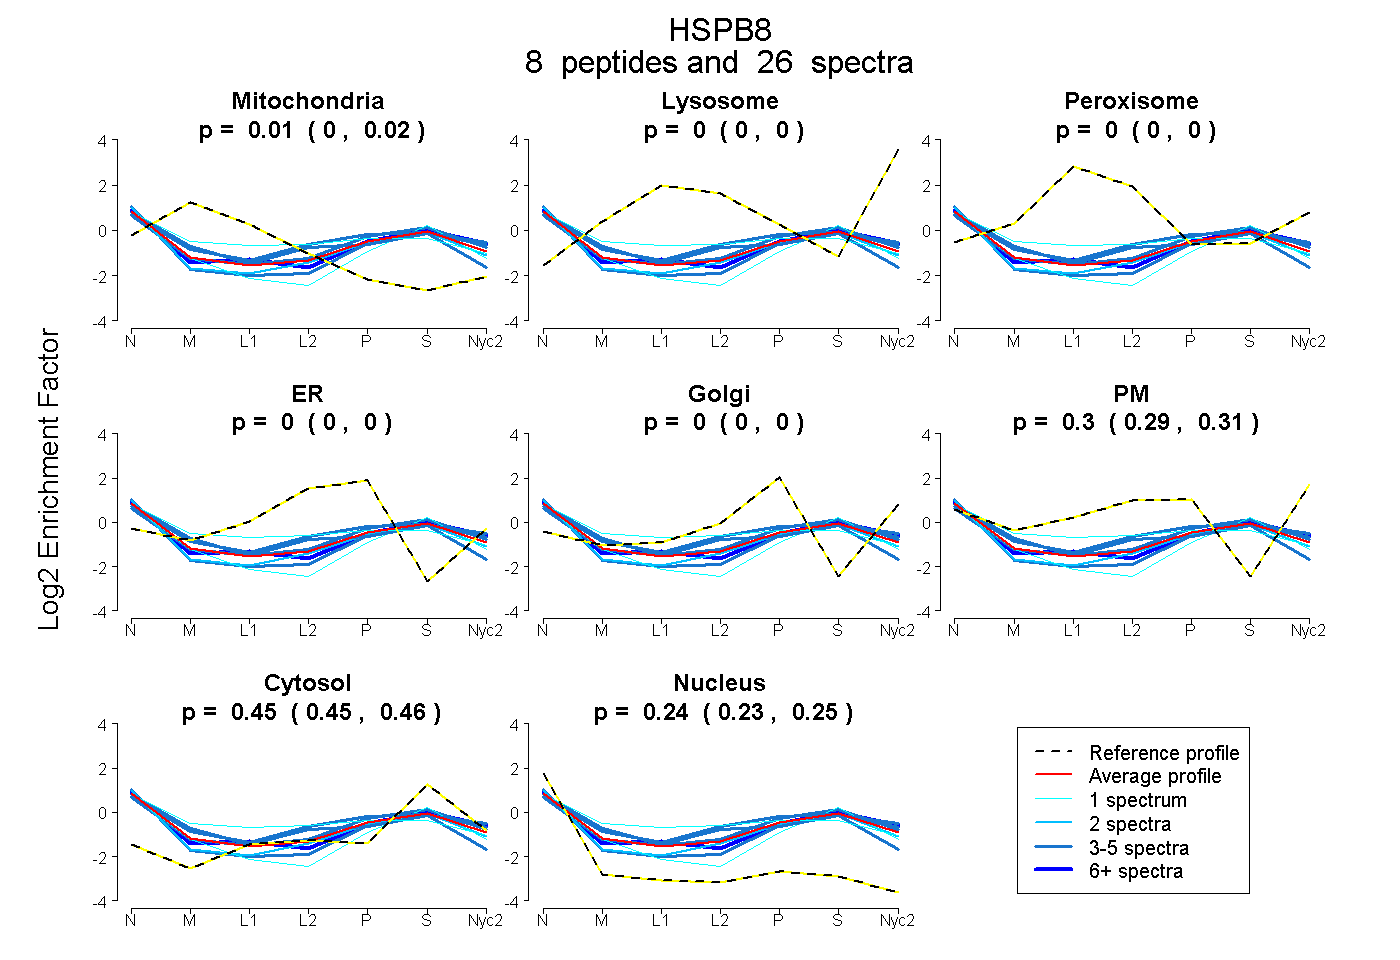
0.000 | 0.019
0.000 | 0.000
0.000 | 0.000
0.000 | 0.000
0.000 | 0.000
0.294 | 0.311
0.447 | 0.455
0.229 | 0.245
| Plot | Mito | Lyso | Perox | ER | Golgi | PM | Cytosol | Nucleus | |||||
| Expt A |
8 peptides |
26 spectra |
|
0.008 0.000 | 0.019 |
0.000 0.000 | 0.000 |
0.000 0.000 | 0.000 |
0.000 0.000 | 0.000 |
0.000 0.000 | 0.000 |
0.303 0.294 | 0.311 |
0.452 0.447 | 0.455 |
0.238 0.229 | 0.245 |
| 4 spectra, QQEGGIVSK | 0.040 | 0.000 | 0.000 | 0.001 | 0.000 | 0.383 | 0.429 | 0.148 | ||
| 4 spectra, SGMVPR | 0.078 | 0.000 | 0.000 | 0.000 | 0.000 | 0.347 | 0.421 | 0.154 | ||
| 1 spectrum, NPPPFPGEPWK | 0.030 | 0.000 | 0.000 | 0.000 | 0.061 | 0.079 | 0.513 | 0.317 | ||
| 2 spectra, LSSAWPGTLR | 0.000 | 0.000 | 0.000 | 0.000 | 0.011 | 0.242 | 0.452 | 0.295 | ||
| 1 spectrum, VCVNVHSFKPEELMVK | 0.138 | 0.000 | 0.117 | 0.035 | 0.000 | 0.240 | 0.304 | 0.165 | ||
| 3 spectra, FGVPAEGR | 0.000 | 0.000 | 0.000 | 0.000 | 0.027 | 0.291 | 0.495 | 0.187 | ||
| 3 spectra, GPTATAR | 0.000 | 0.000 | 0.000 | 0.000 | 0.109 | 0.097 | 0.428 | 0.366 | ||
| 8 spectra, DSPLSSR | 0.000 | 0.000 | 0.000 | 0.000 | 0.000 | 0.304 | 0.472 | 0.224 |
| Plot | Lyso | Other | |||||||||||
| Expt C |
2 peptides |
6 spectra |
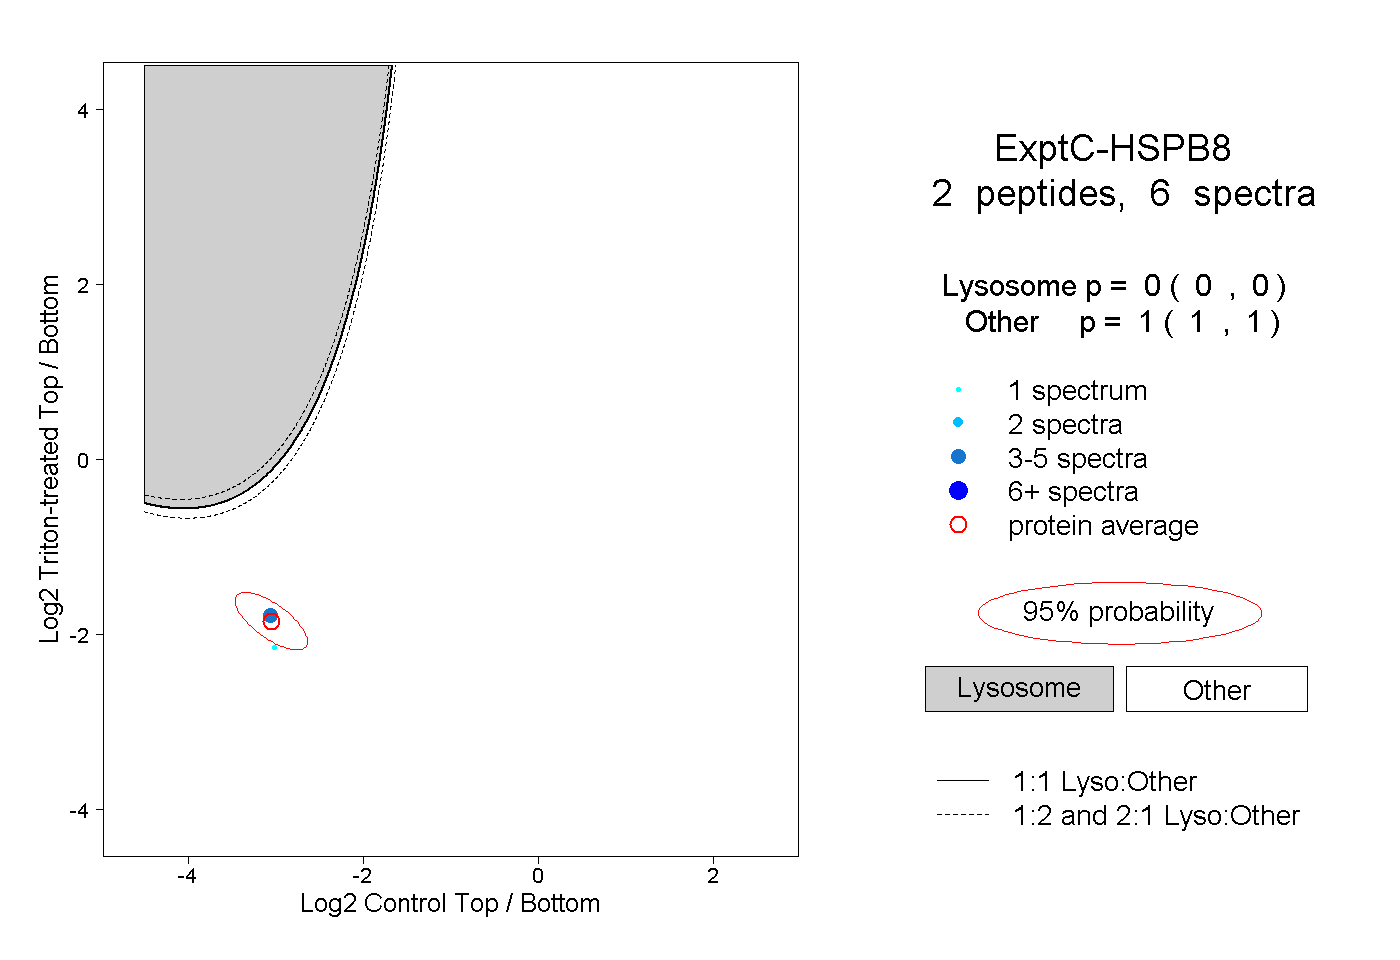 |
0.000 0.000 | 0.000 |
1.000 1.000 | 1.000 |