 6
6peptides
spectra
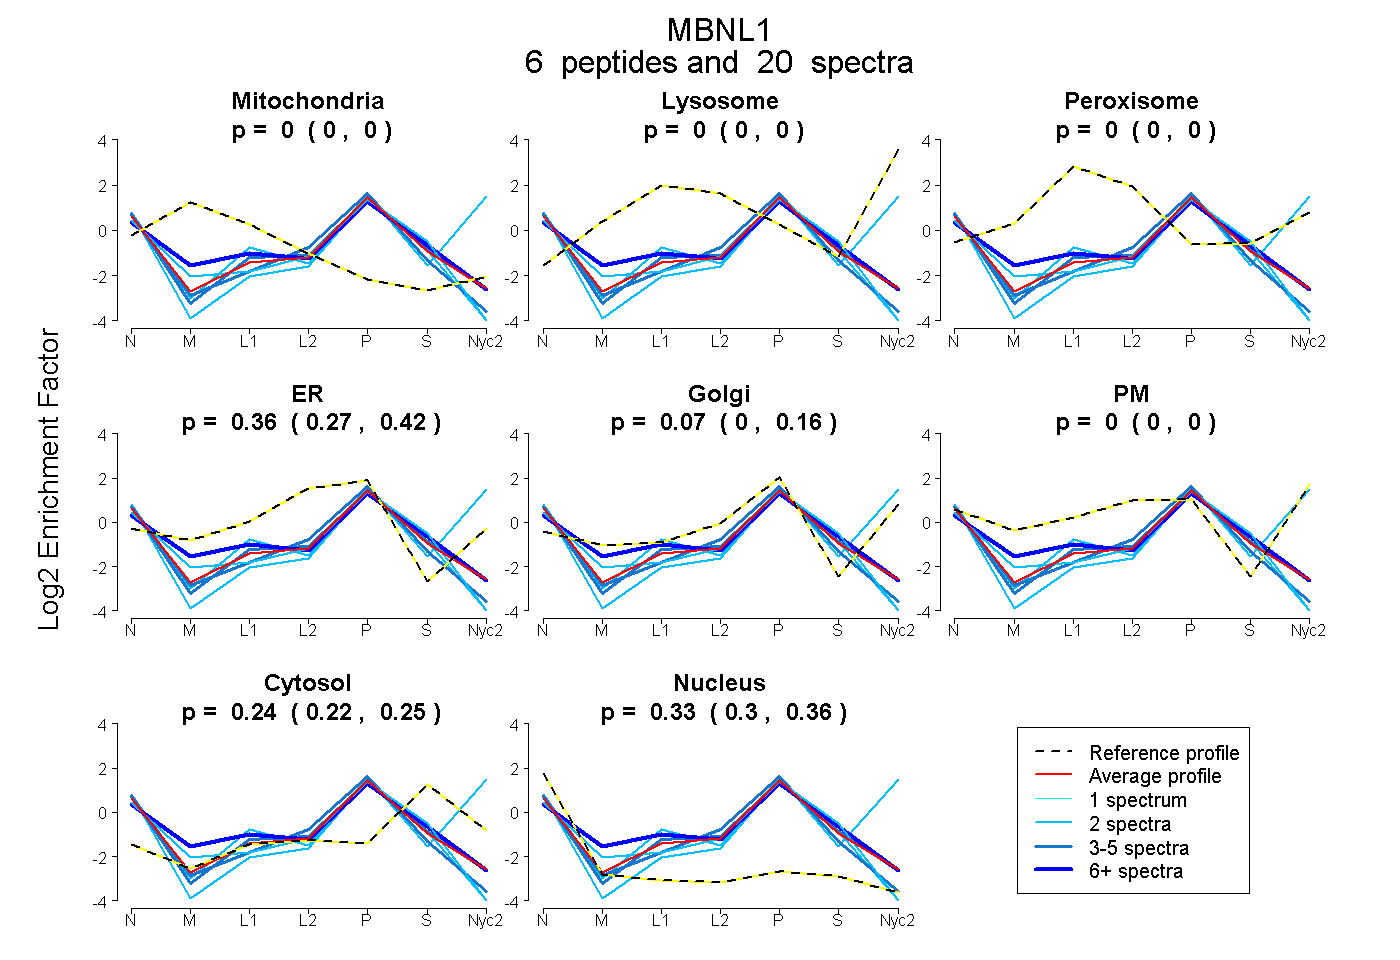
0.000 | 0.000
0.000 | 0.000
0.000 | 0.000
0.272 | 0.417
0.000 | 0.164
0.000 | 0.000
0.221 | 0.248
0.304 | 0.355
5peptides
spectra
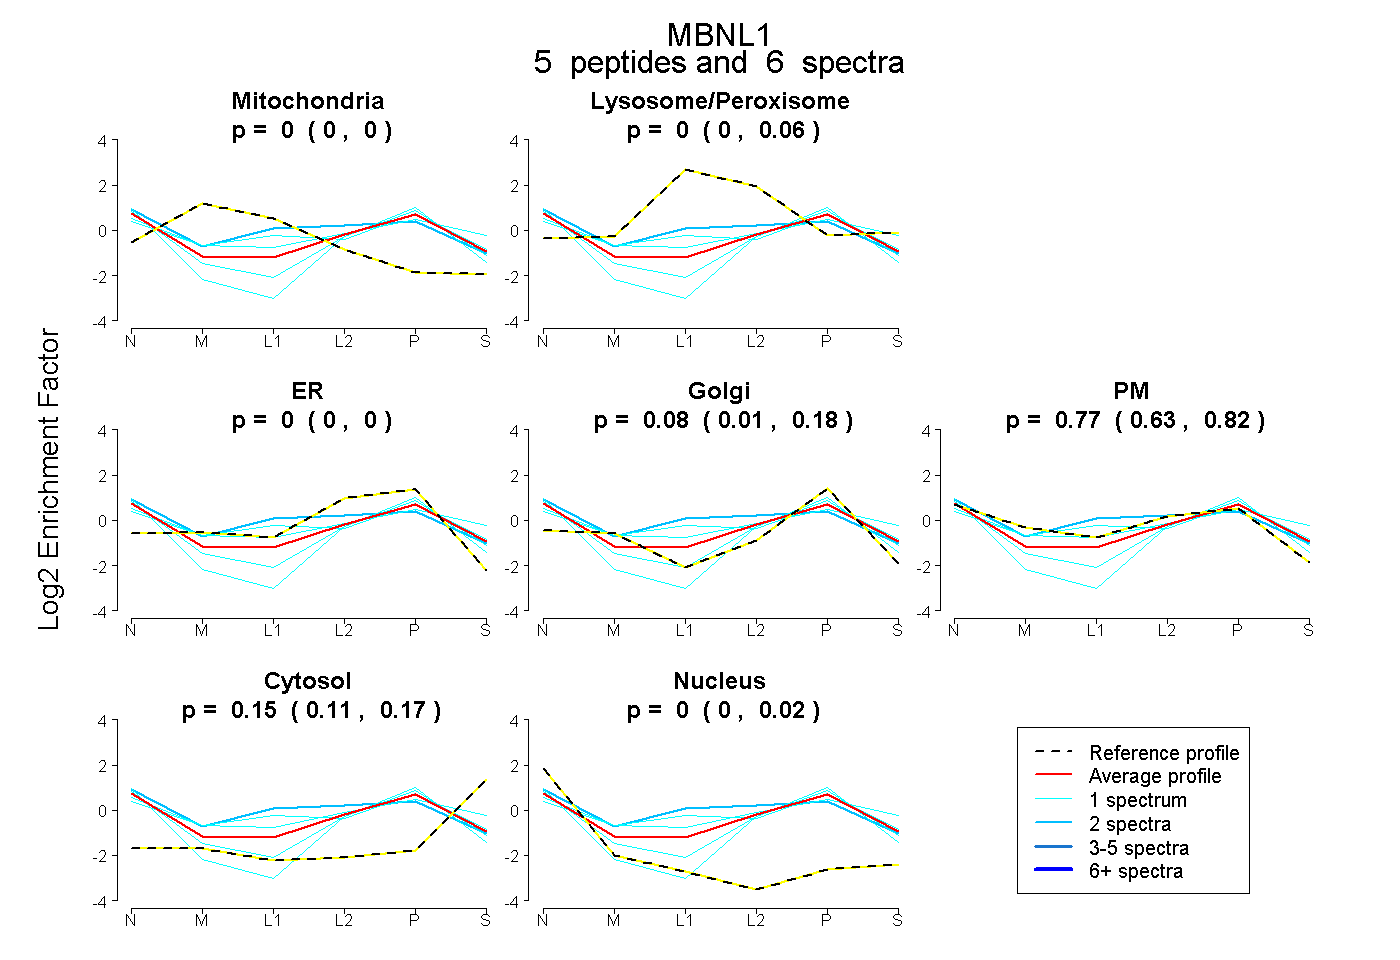
0.000 | 0.000
0.000 | 0.055
0.000 | 0.000
0.009 | 0.182
0.635 | 0.817
0.113 | 0.173
0.000 | 0.019
2peptides
spectra
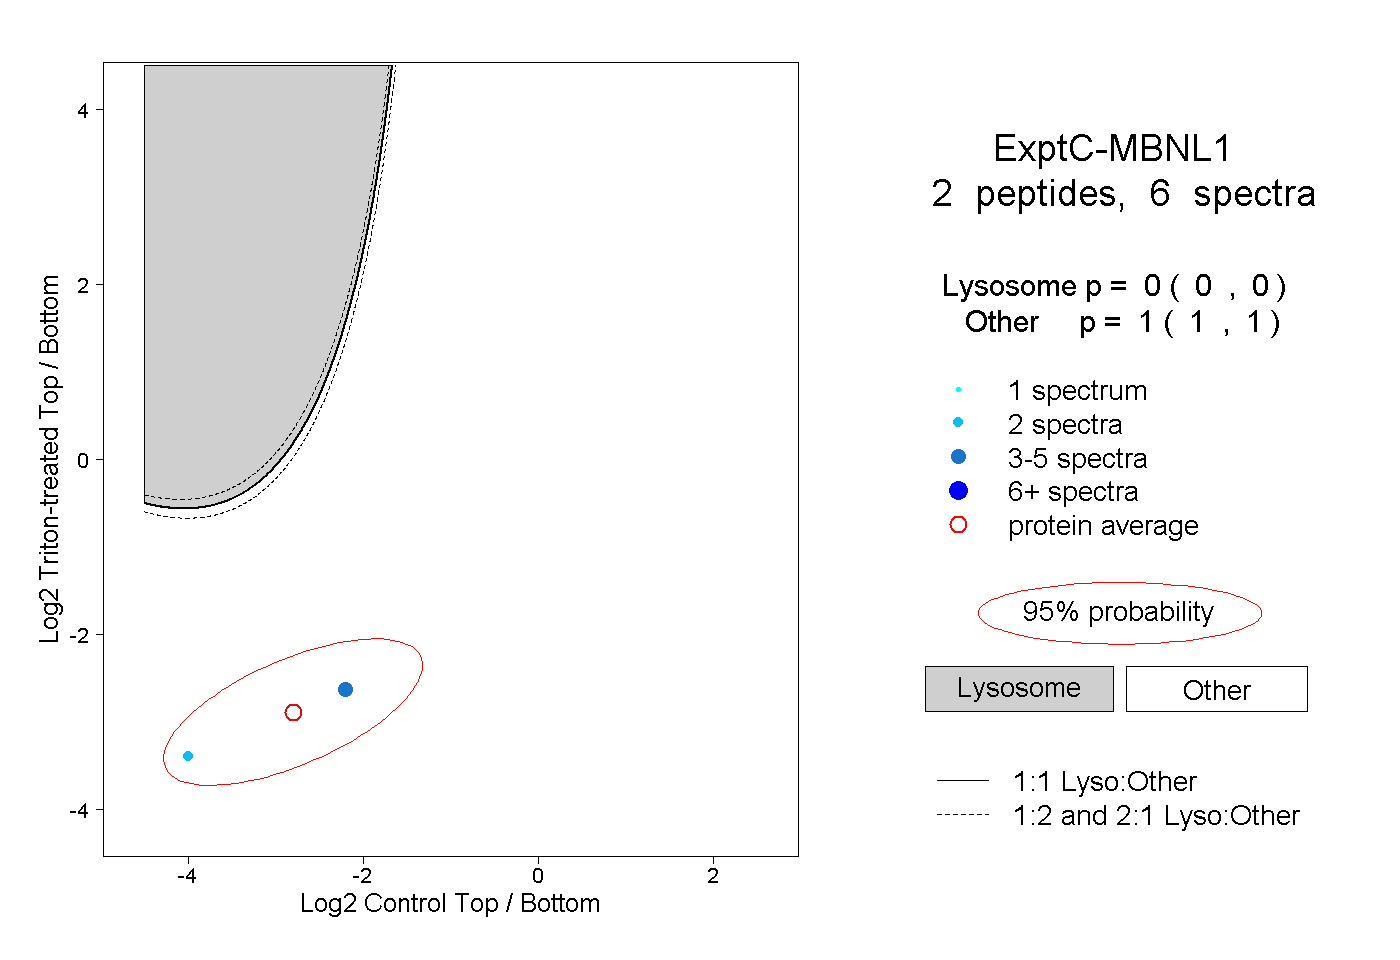
0.000 | 0.000
1.000 | 1.000
1peptide
spectrum
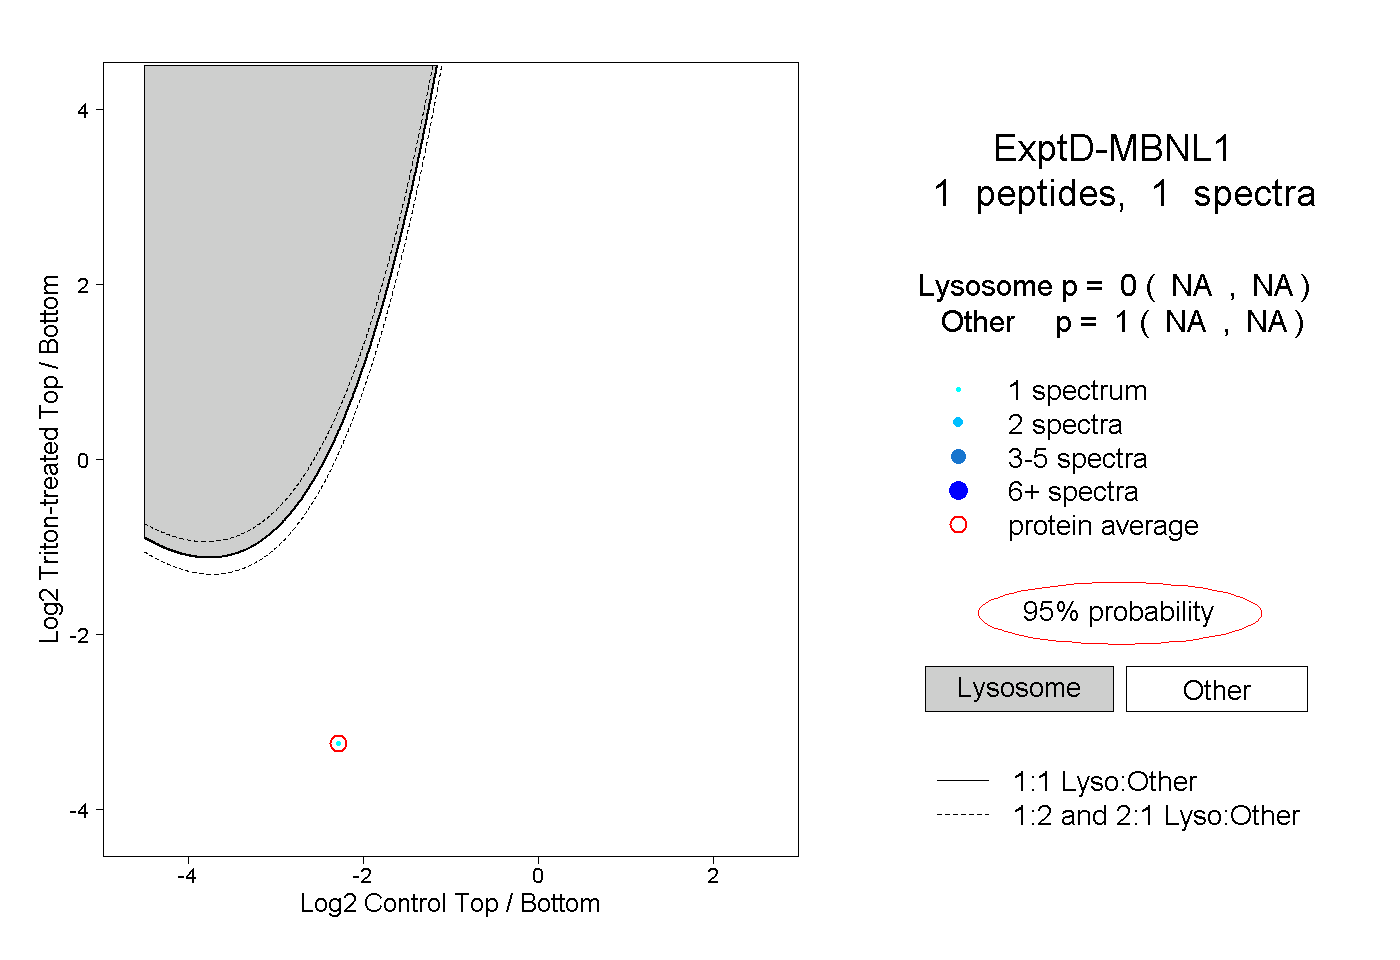
NA | NA
NA | NA