MBNL1
[ENSRNOP00000033304]
Main page
| | | Plot |
Mito |
Lyso |
|
Perox |
ER |
Golgi |
PM |
Cytosol |
Nucleus |
|
| Expt A |
 6
6
peptides |
20
spectra |
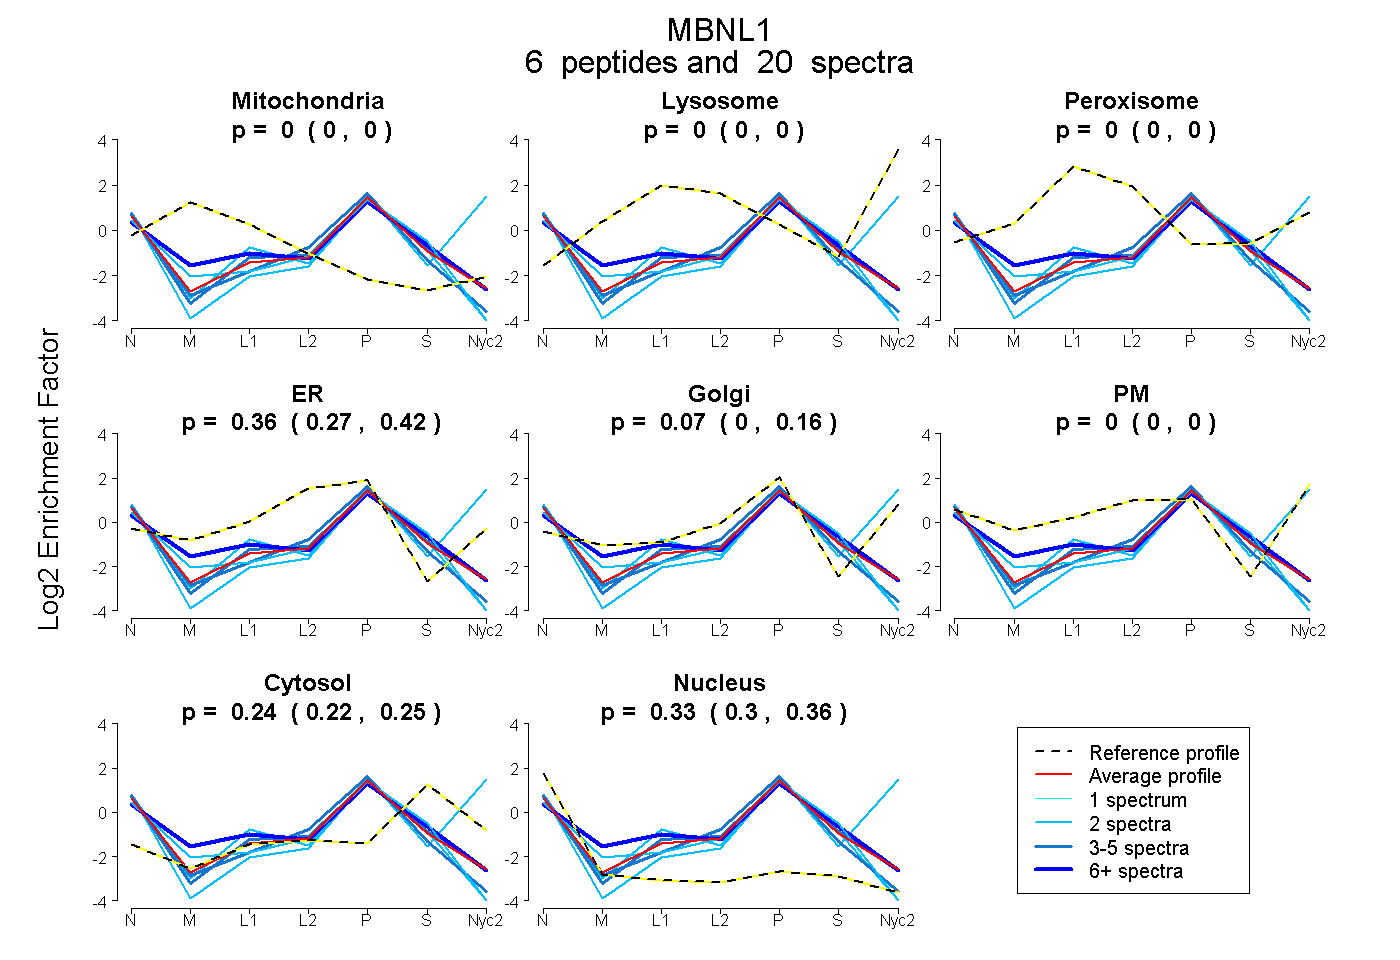 |
0.000
0.000 | 0.000 |
0.000
0.000 | 0.000 |
|
0.000
0.000 | 0.000 |
0.362
0.272 | 0.417 |
0.071
0.000 | 0.164 |
0.000
0.000 | 0.000 |
0.236
0.221 | 0.248 |
0.331
0.304 | 0.355 |
|
| | | Plot |
Mito |
|
Lyso or Perox |
|
ER |
Golgi |
PM |
Cytosol |
Nucleus |
|
| Expt B |
5
peptides |
6
spectra |
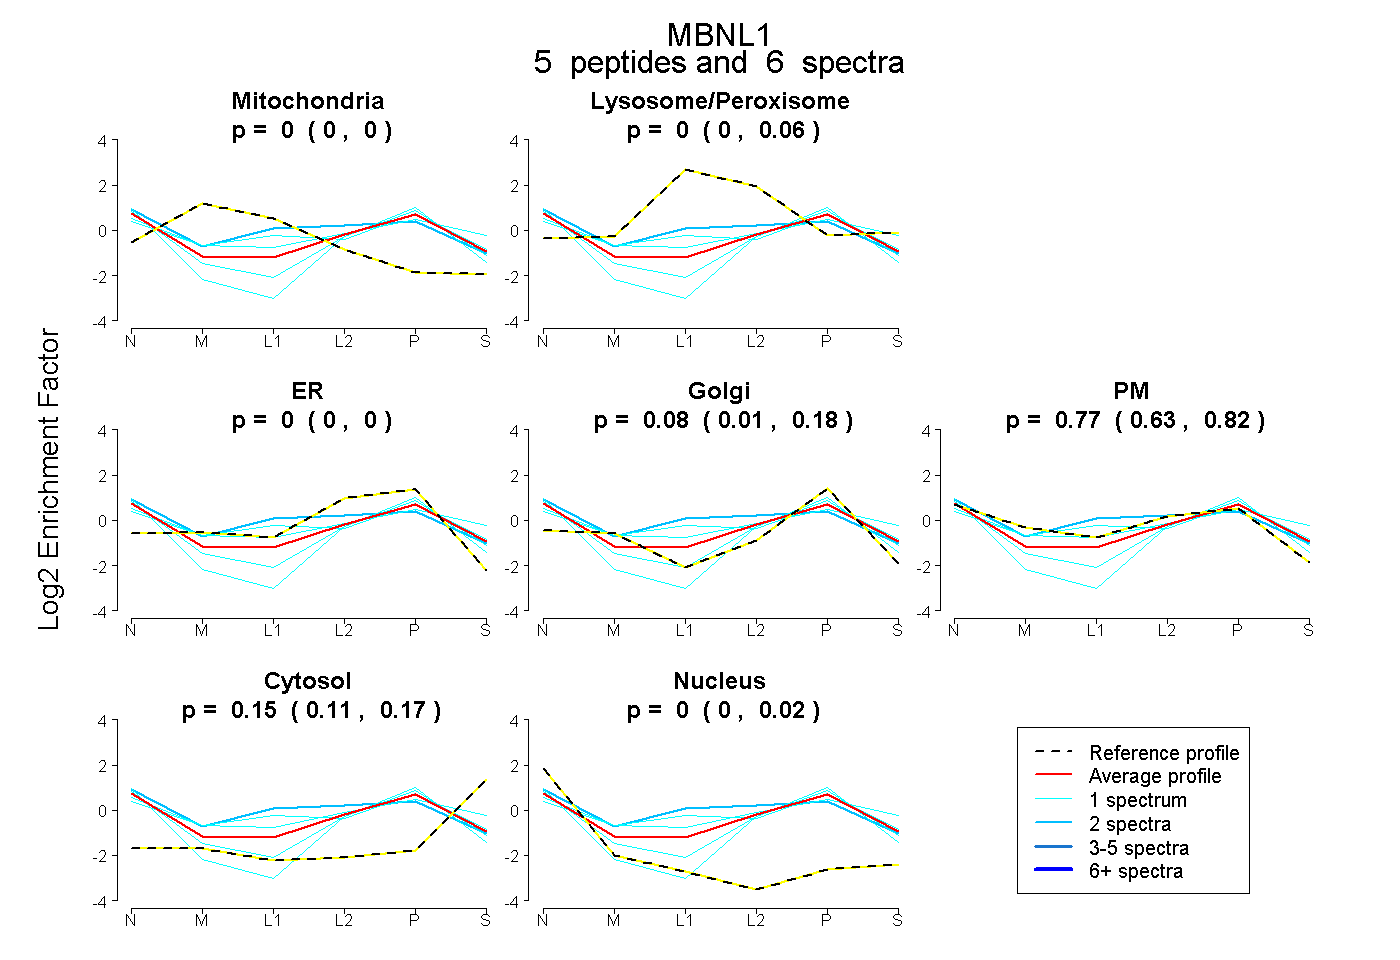 |
0.000
0.000 | 0.000 |
|
0.000
0.000 | 0.055 |
|
0.000
0.000 | 0.000 |
0.076
0.009 | 0.182 |
0.771
0.635 | 0.817 |
0.153
0.113 | 0.173 |
0.000
0.000 | 0.019 |
|
| 2 spectra, GTCSRPDTECK |
0.000 |
|
0.277 |
|
0.000 |
0.000 |
0.630 |
0.009 |
0.084 |
|
| 1 spectrum, YFHPPAHLQAK |
0.000 |
|
0.153 |
|
0.000 |
0.070 |
0.559 |
0.218 |
0.000 |
|
| 1 spectrum, WLTLEVCR |
0.000 |
|
0.000 |
|
0.000 |
0.397 |
0.448 |
0.083 |
0.071 |
|
| 1 spectrum, NNLIQQK |
0.000 |
|
0.271 |
|
0.000 |
0.298 |
0.322 |
0.037 |
0.072 |
|
| 1 spectrum, VIACFDSLK |
0.000 |
|
0.000 |
|
0.132 |
0.643 |
0.011 |
0.000 |
0.213 |
|
| | | Plot |
|
Lyso |
|
|
|
|
|
|
|
Other |
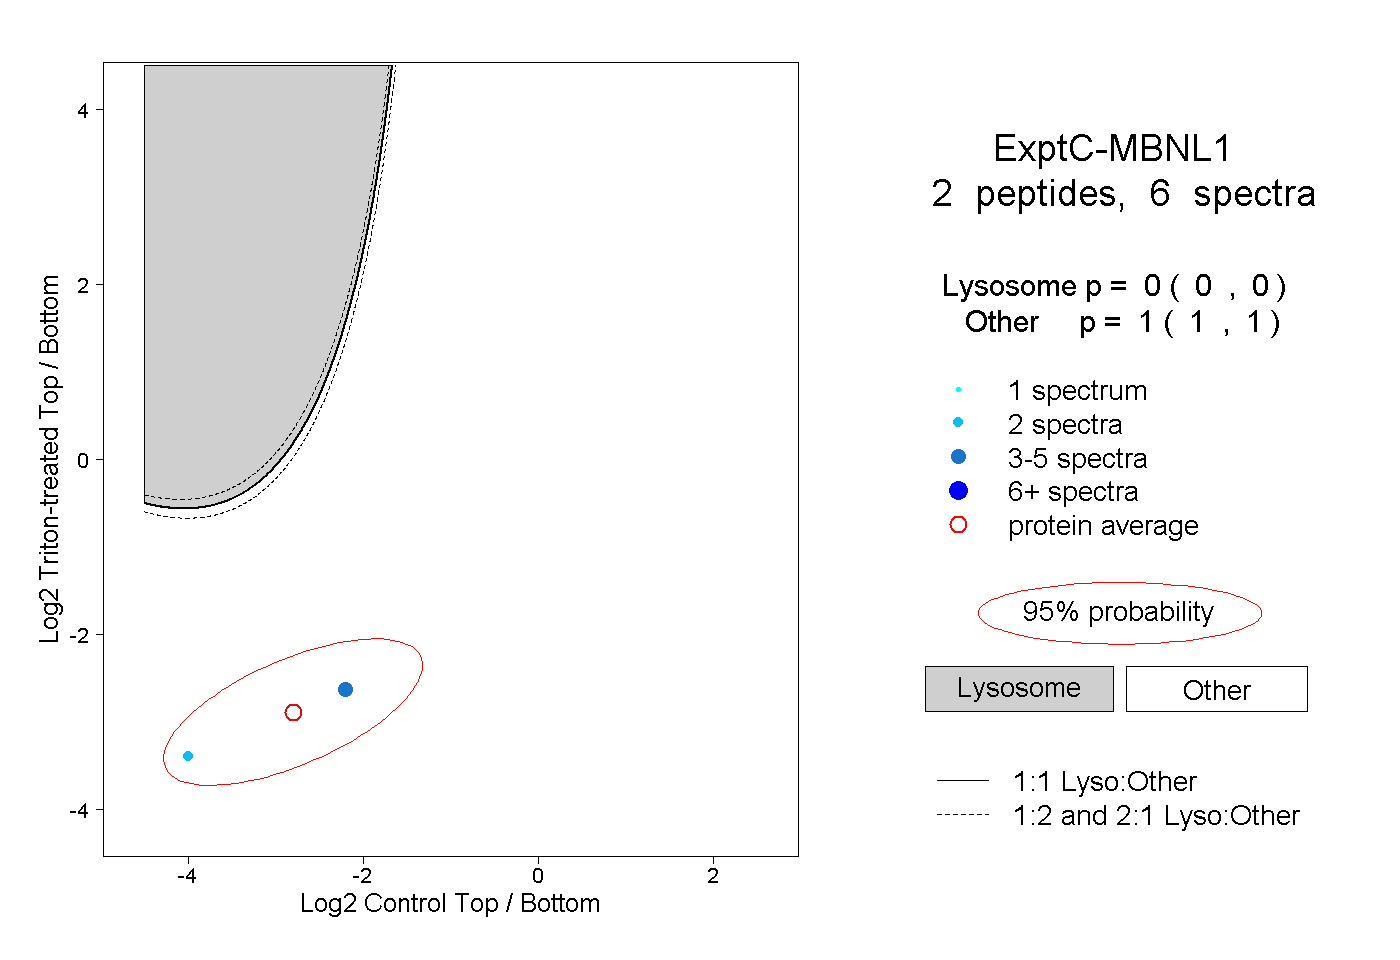
| Expt C |
2
peptides |
6
spectra |
 |
|
0.000
0.000 | 0.000 |
|
|
|
|
|
|
|
1.000
1.000 | 1.000 |
| | | Plot |
|
Lyso |
|
|
|
|
|
|
|
Other |
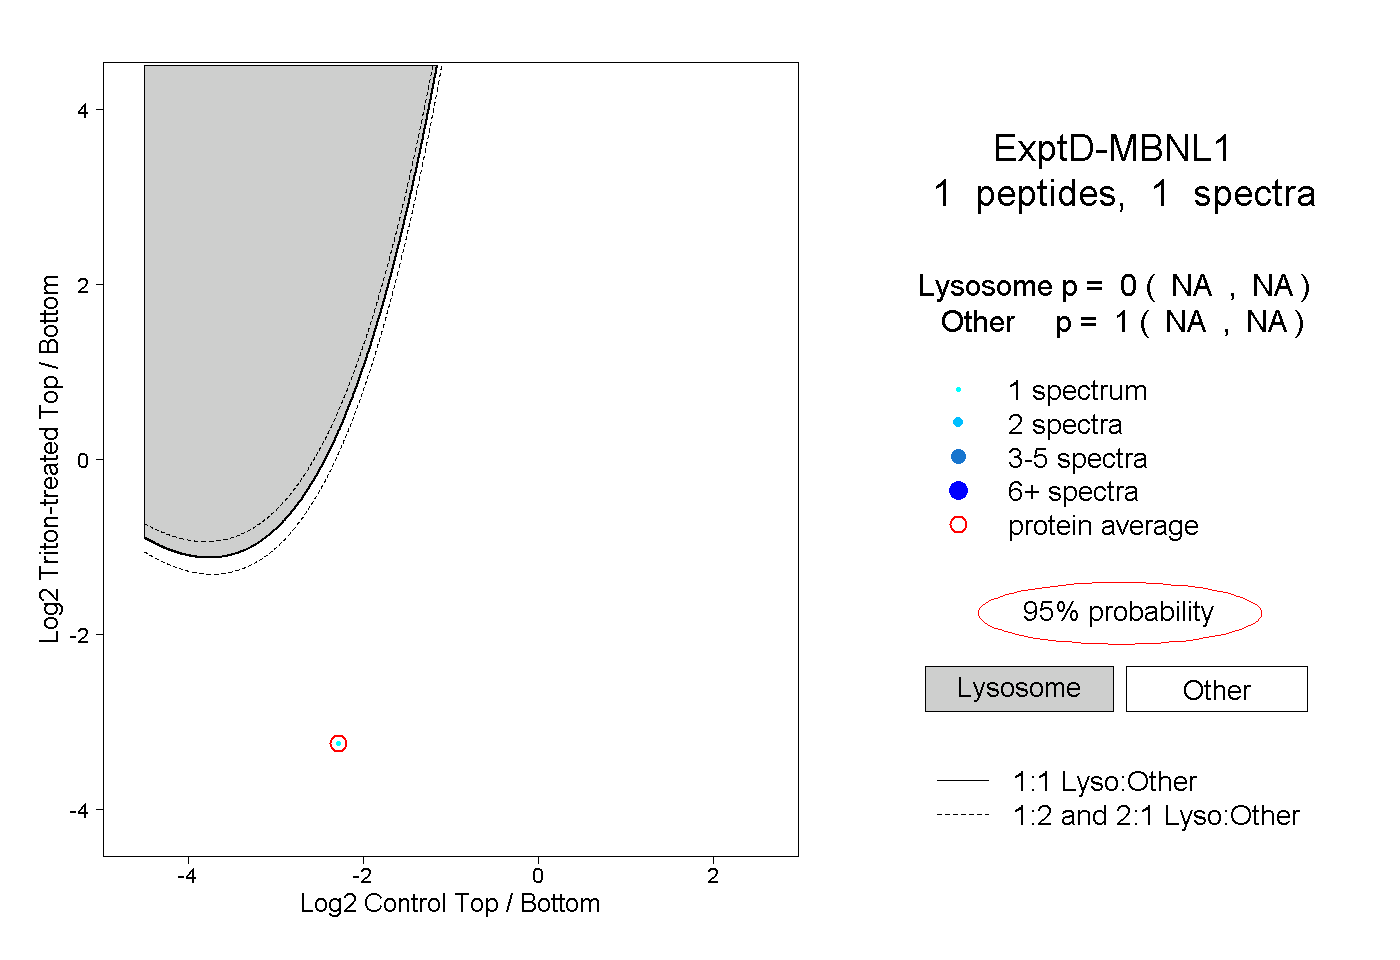
| Expt D |
1
peptide |
1
spectrum |
 |
|
0.000
NA | NA |
|
|
|
|
|
|
|
1.000
NA | NA |