 4
4peptides
spectra

0.000 | 0.000
0.184 | 0.296
0.662 | 0.788
0.000 | 0.060
0.000 | 0.000
0.000 | 0.000
0.000 | 0.000
0.000 | 0.000
3peptides
spectra
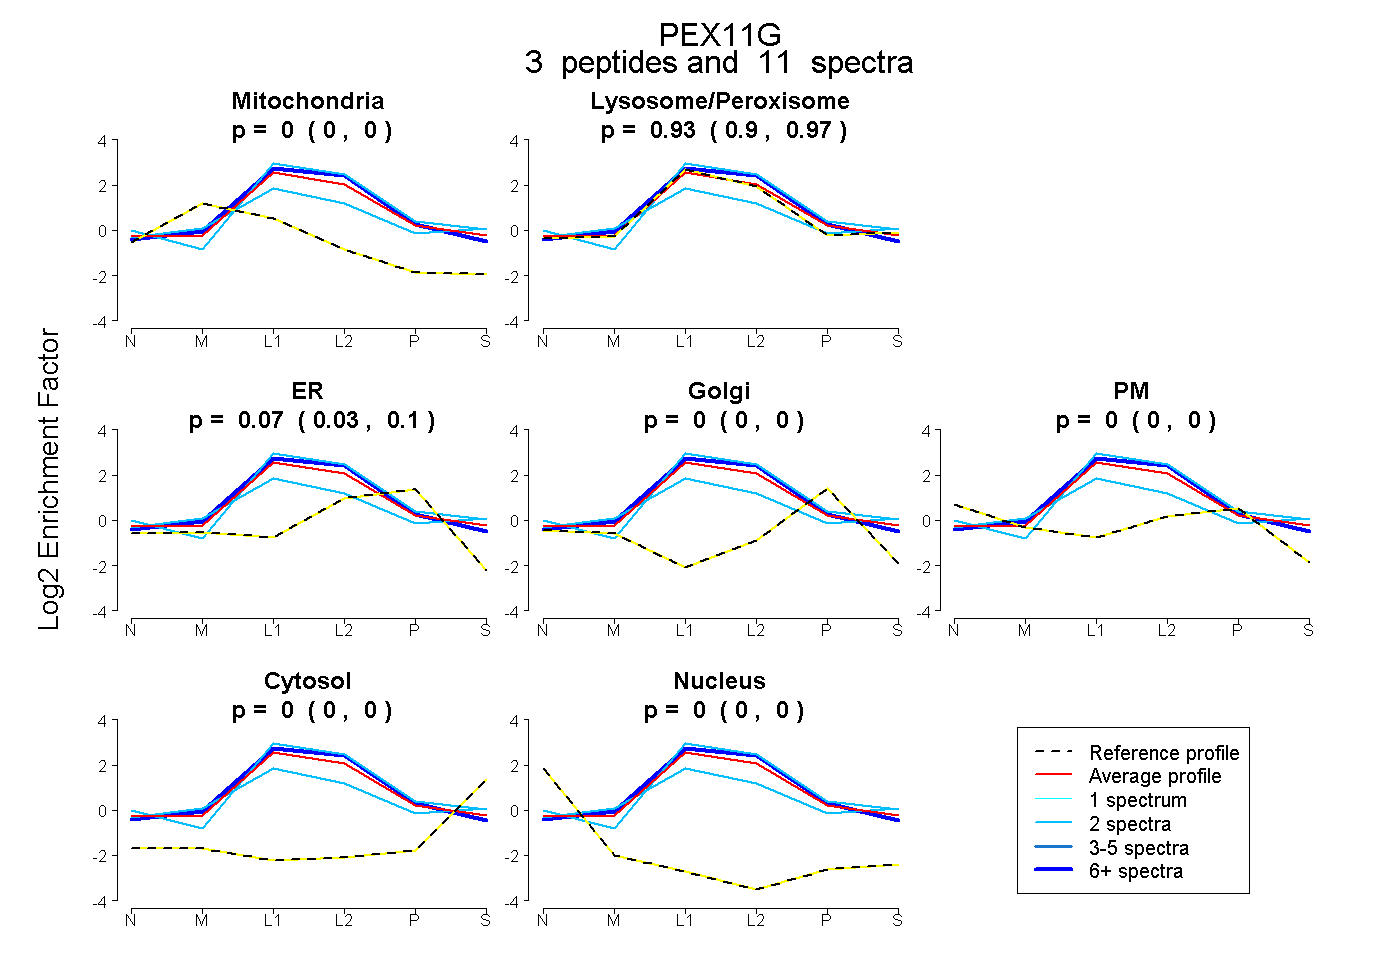
0.000 | 0.000
0.897 | 0.965
0.027 | 0.098
0.000 | 0.000
0.000 | 0.000
0.000 | 0.000
0.000 | 0.000
5peptides
spectra

0.000 | 0.000
1.000 | 1.000
2peptides
spectra
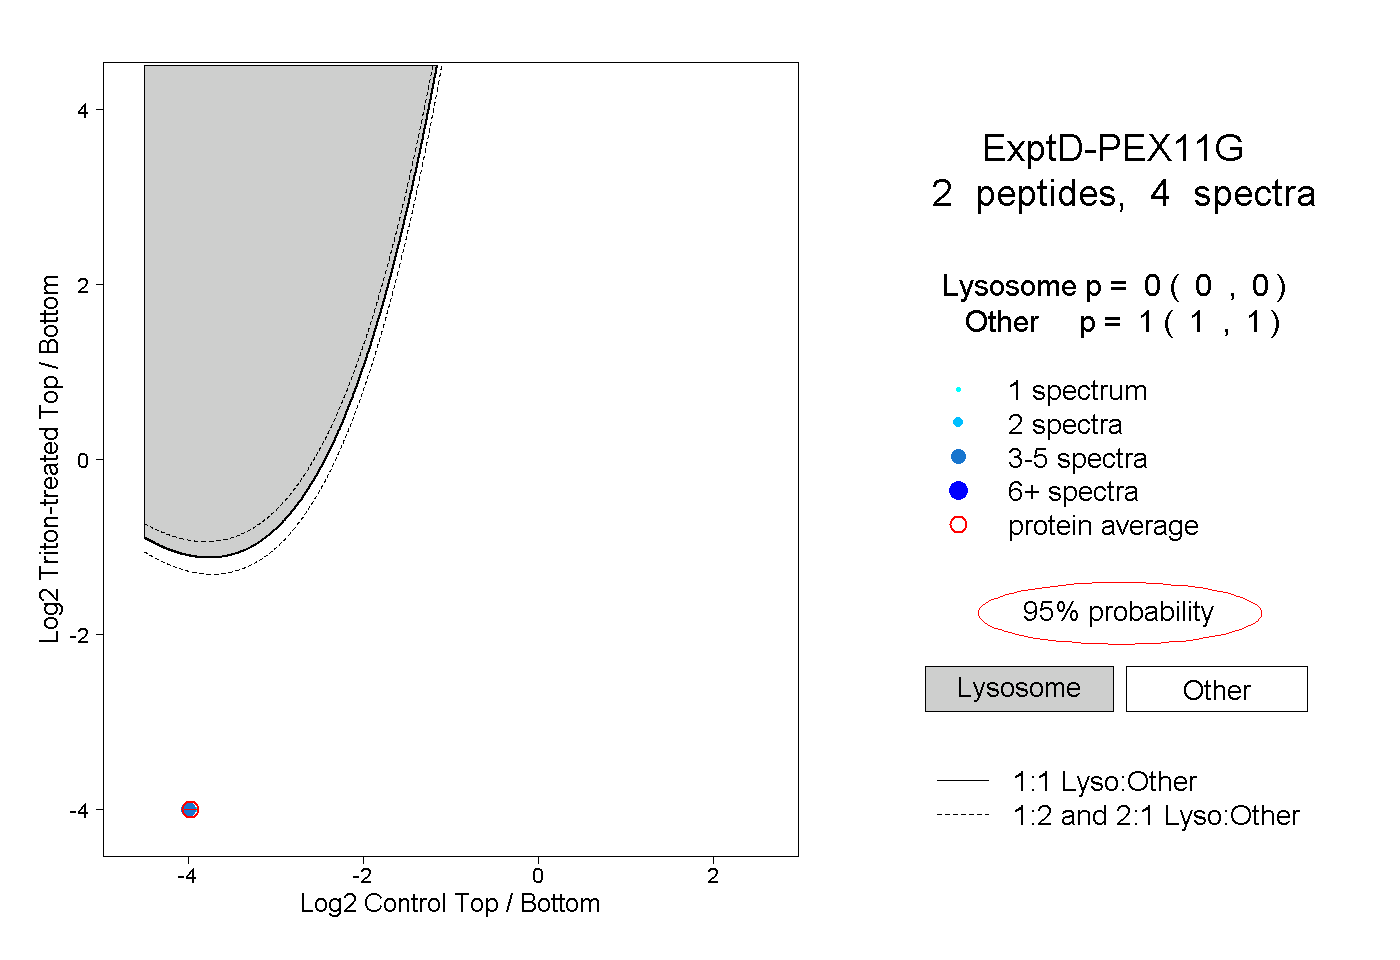
0.000 | 0.000
1.000 | 1.000